








 Web Trader MT5









XRP Technical Analysis
XRP has recently seen a moderate recovery in price, moving back up and consolidating slightly above the $2.20 level. The short-term moving averages MA(5) and MA(10) crossed back above the longer-term 30-period moving average, which is a common short-term bullish signal.
MACD is slightly above the signal line, indicating positive momentum. However, the bullish momentum from the recent low might be waning or consolidating.
While the overall trend has been down, recent price action suggest a short-term upward swing is in play. Watch for a decisive break and hold above the recent consolidation high around $2.30 to confirm a stronger reversal.
XRP 4H Chart
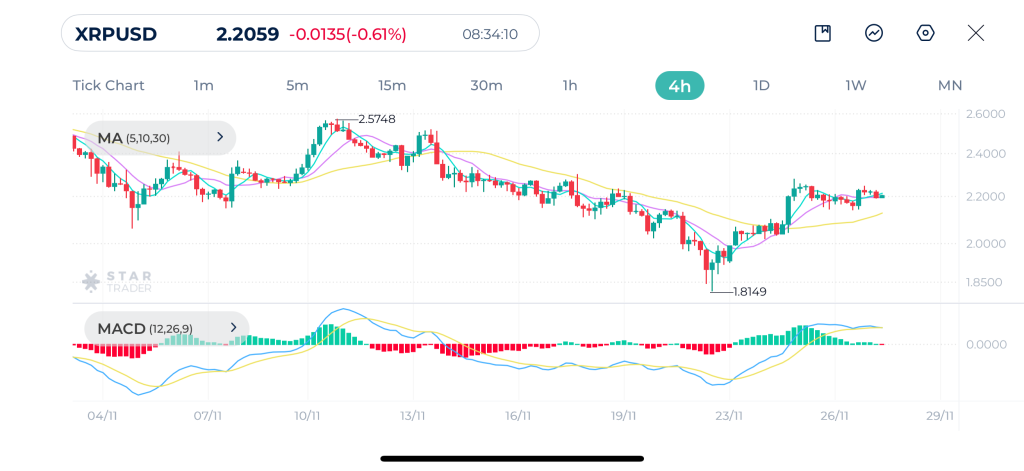
| Resistance | $2.28 | $2.40 | $2.52 |
| Support | $2.14 | $2.02 | $1.89 |
EURUSD Technical Analysis
The hourly chart of EURUSD displays a clear, consistent uptrend in the short term. All three moving averages are widely separated and sloped upward, with price trading right along the short-term moving averages, which is a positive sign for the trend.
Moving averages are acting as dynamic support.
MACD line is above the signal line. However, momentum might be slightly easing at the very top of the rally, which is common before a minor consolidation.
The trend is up in the short term, supported by price action and technicals. The slight slowdown in MACD momentum suggests a minor retracement or consolidation may be near. It’s important to look for support around the moving averages MA(5) and MA(10) or a break of the recent high 1.1613 to confirm the continuation.
EURUSD 1H Chart
| Resistance | 1.1606 | 1.1625 | 1.1658 |
| Support | 1.1574 | 1.1558 | 1,1525 |
Nasdaq Technical Analysis
Nasdaq has shown a sharp decline from a peak around 25,768 to a strong low at 23,857. Since hitting the low, there has been a very strong and sustained rally, with the price now near its high for the current upward movement.
A strong bullish cross occurred when the 5 and 10 period moving averages moved above the 30-period moving average. All of which are now angled upward, and the price is trading above all three, indicating a strong current uptrend.
MACD line is clearly above the signal line, which supports a strong, accelerating positive momentum.
Current price action on the 4H chart points to a robust, active uptrend. The immediate challenge is whether the rally can break the prior high of 25,768.
Nasdaq 4H Chart
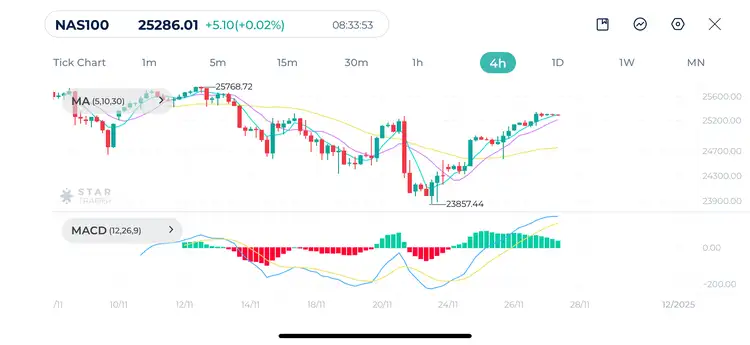
| Resistance | 25,501 | 25,940 | 26,527 |
| Support | 25,063 | 24,918 | 24,526 |
Tags


Open Live Account
 Email Address
 Phone Number
Important Notice
STARTRADER does not accept any applications from Australian residents.
To comply with regulatory requirements, clicking the button will redirect you to the STARTRADER website operated by STARTRADER PRIME GLOBAL PTY LTD (ABN 65 156 005 668), an authorized Australian Financial Services Licence holder (AFSL no. 421210) regulated by the Australian Securities and Investments Commission.
Important Notice for Residents of the United Arab Emirates
In alignment with local regulatory requirements, individuals residing in the United Arab Emirates are requested to proceed via our dedicated regional platform at startrader.ae, which is operated by STARTRADER Global Financial Consultation & Financial Analysis L.L.C.. This entity is licensed by the UAE Capital Market Authority (CMA) under License No. 20200000241, and is authorised to introduce financial services and promote financial products in the UAE.
Please click the "Continue" button below to be redirected.


