


Gold Technical Analysis
Gold topped at $3,703 today and is now retreating toward $3,665.
Price has broken below the short-term moving averages MA(5) and MA(10), showing short-term bearish bias. The 30-period moving average is flattening, suggesting consolidation.
MACD shows a strong bearish crossover, meaning sellers are gaining control.
The outlook for gold remains bullish but a break below $3,660 could open the way to $3,613 in the short term.
Gold (XAUUSD) 1H Chart
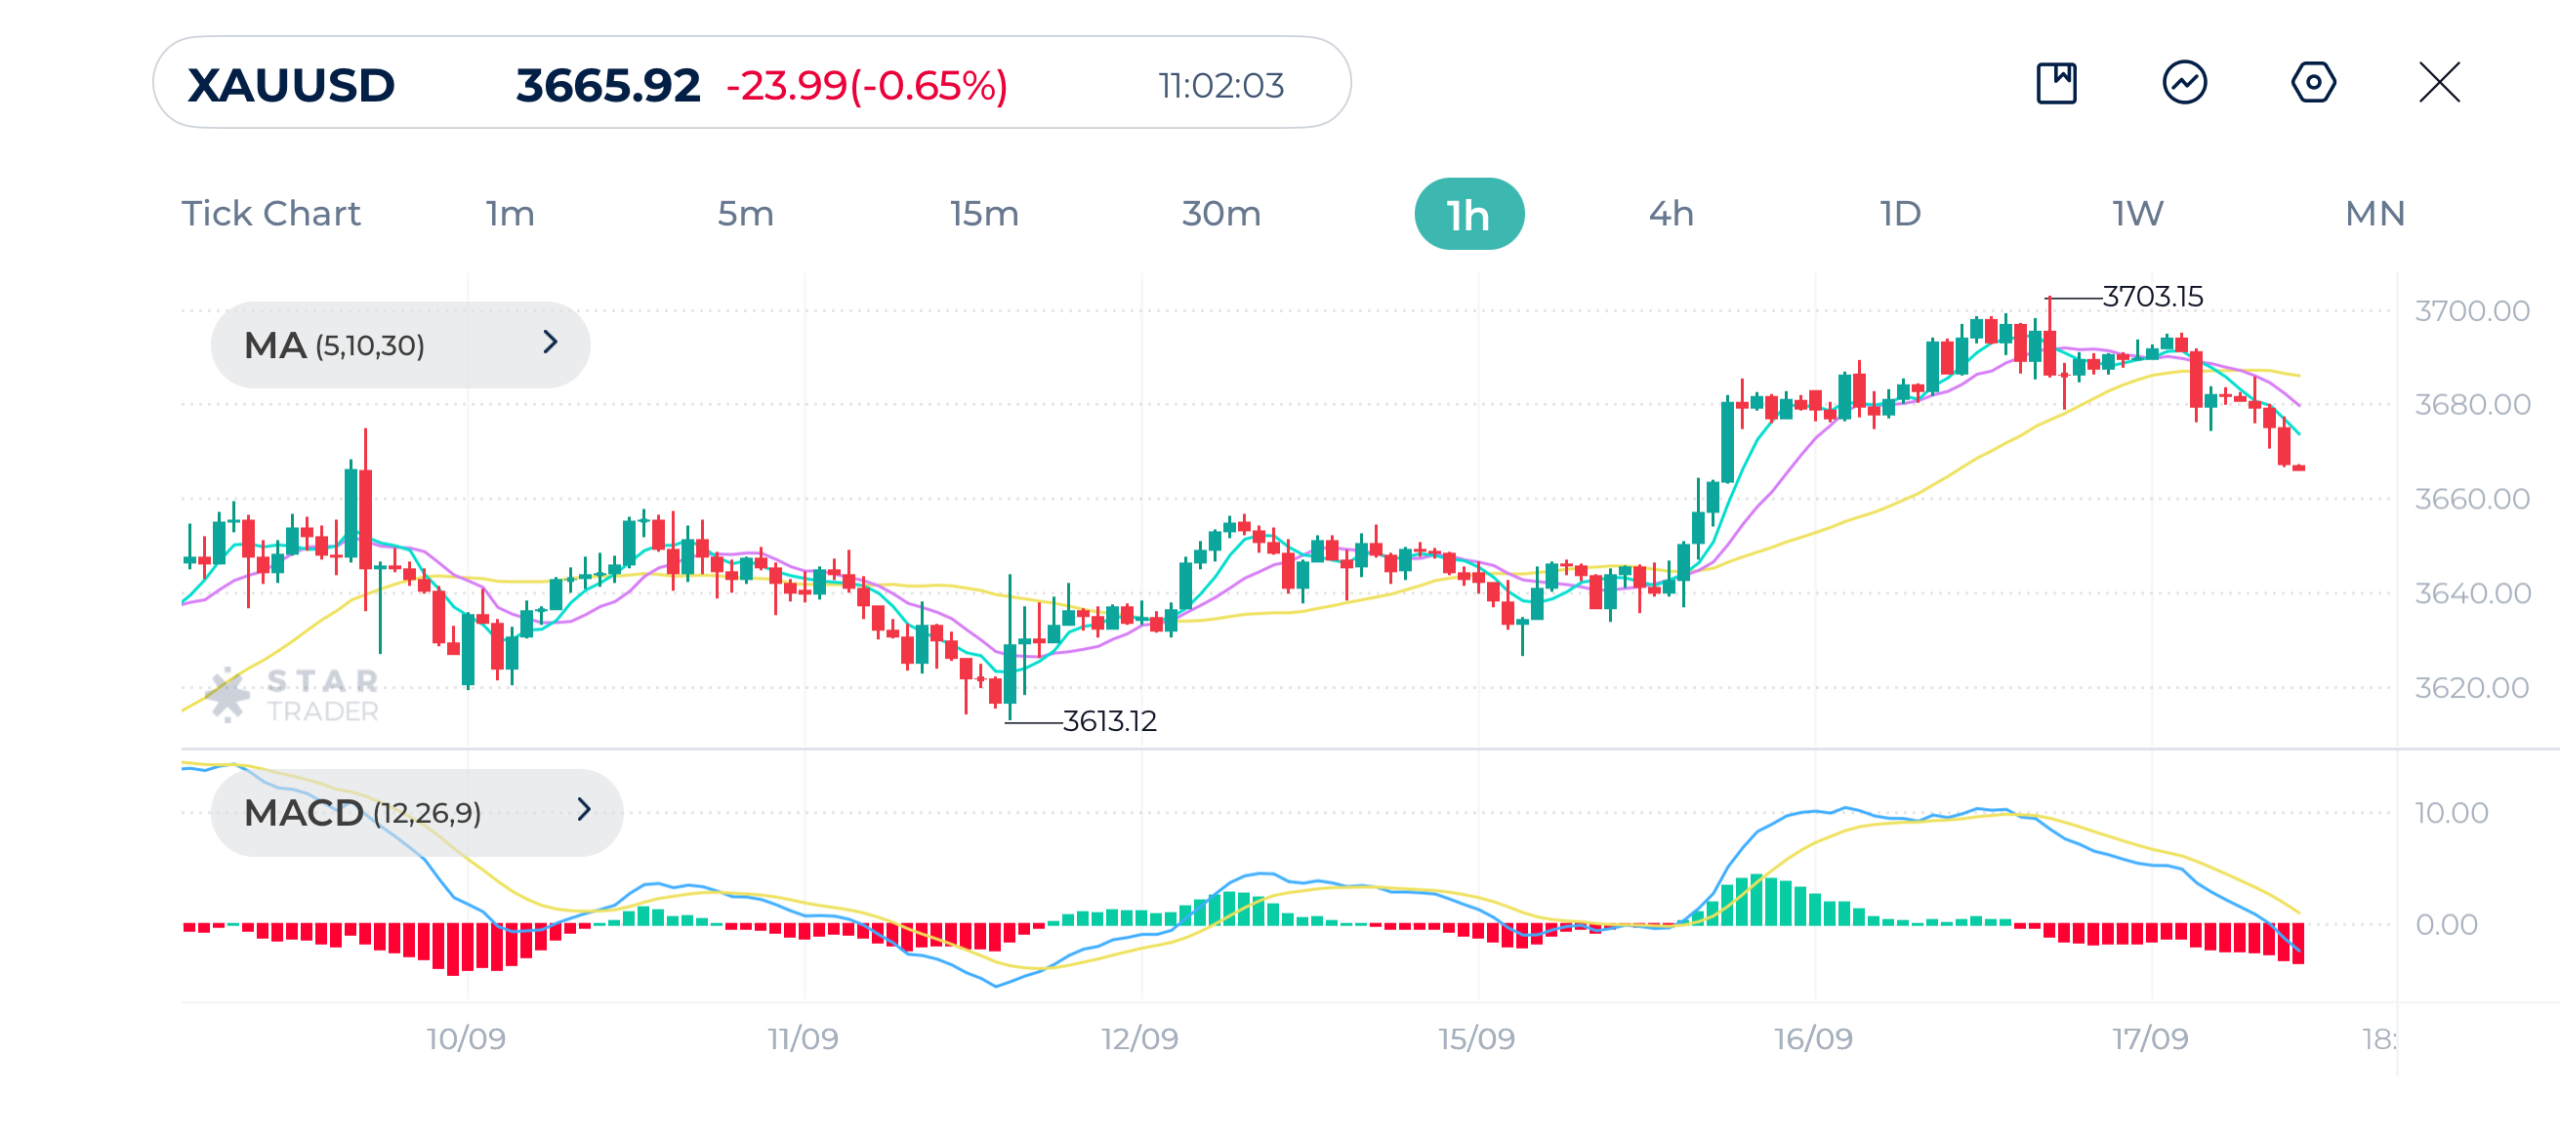
| Resistance | $3,686 | $3,695 | $3,703 |
| Support | $3,654 | $3,633 | $3,615 |
EURUSD Technical Analysis
EURUSD shows a strong rally from 1.1657 low to recent high 1.1878, but momentum is slowing down.
Price is still above the 30-period moving average, keeping the medium-term trend bullish. The short-term moving averages MA(5) and MA(10) are reversing, hinting at a possible pullback.
MACD shows bearish crossover, which indicates short-term selling pressure.
Outlook indicates a short-term retracement toward 1.1820–1.1780, but as long as price stays above 1.1780, the bullish trend remains valid.
EURUSD 1H Chart
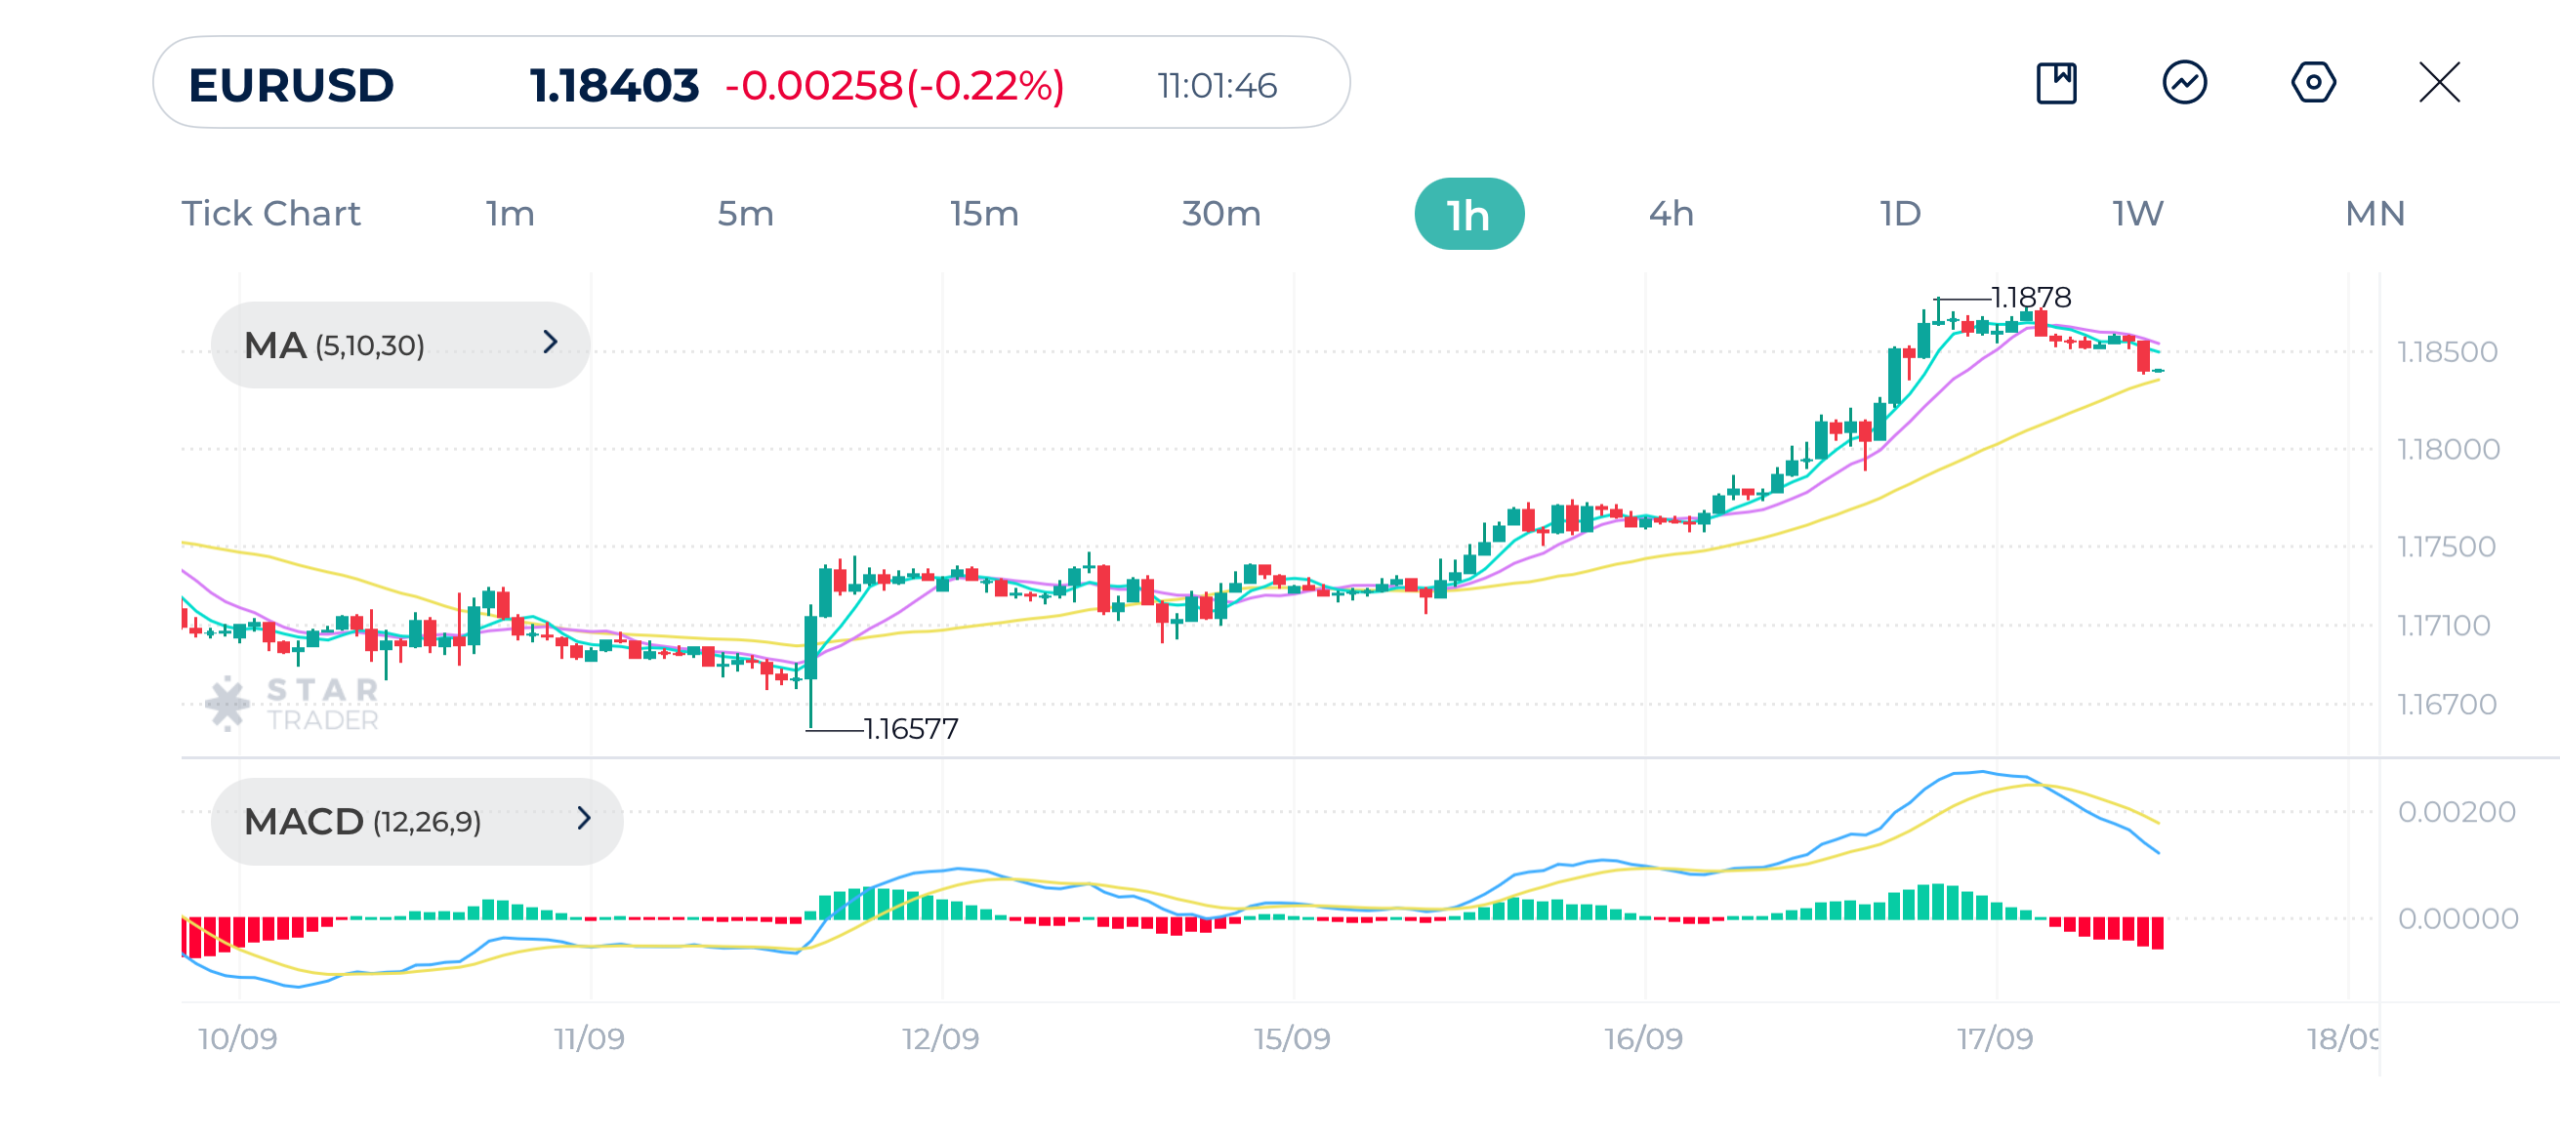
| Resistance | 1.1859 | 1.1878 | 1.1921 |
| Support | 1.1820 | 1.1790 | 1.1771 |
Oil Technical Analysis
Brent recently peaked near $68.88 but is now pulling back slightly. The overall trend from $66 low remains bullish.
Short term moving averages MA(5) and MA(10) are starting to turn downwards, signaling cooling moment. The mid-term moving average MA(30) is still below current price, which keeps the broader trend bullish.
MACD shows a bearish crossover has just occurred, which suggests weakening momentum.
Pullback is likely in the short term, but as long as price stays above $67.50–$68.00, the bullish trend remains intact.
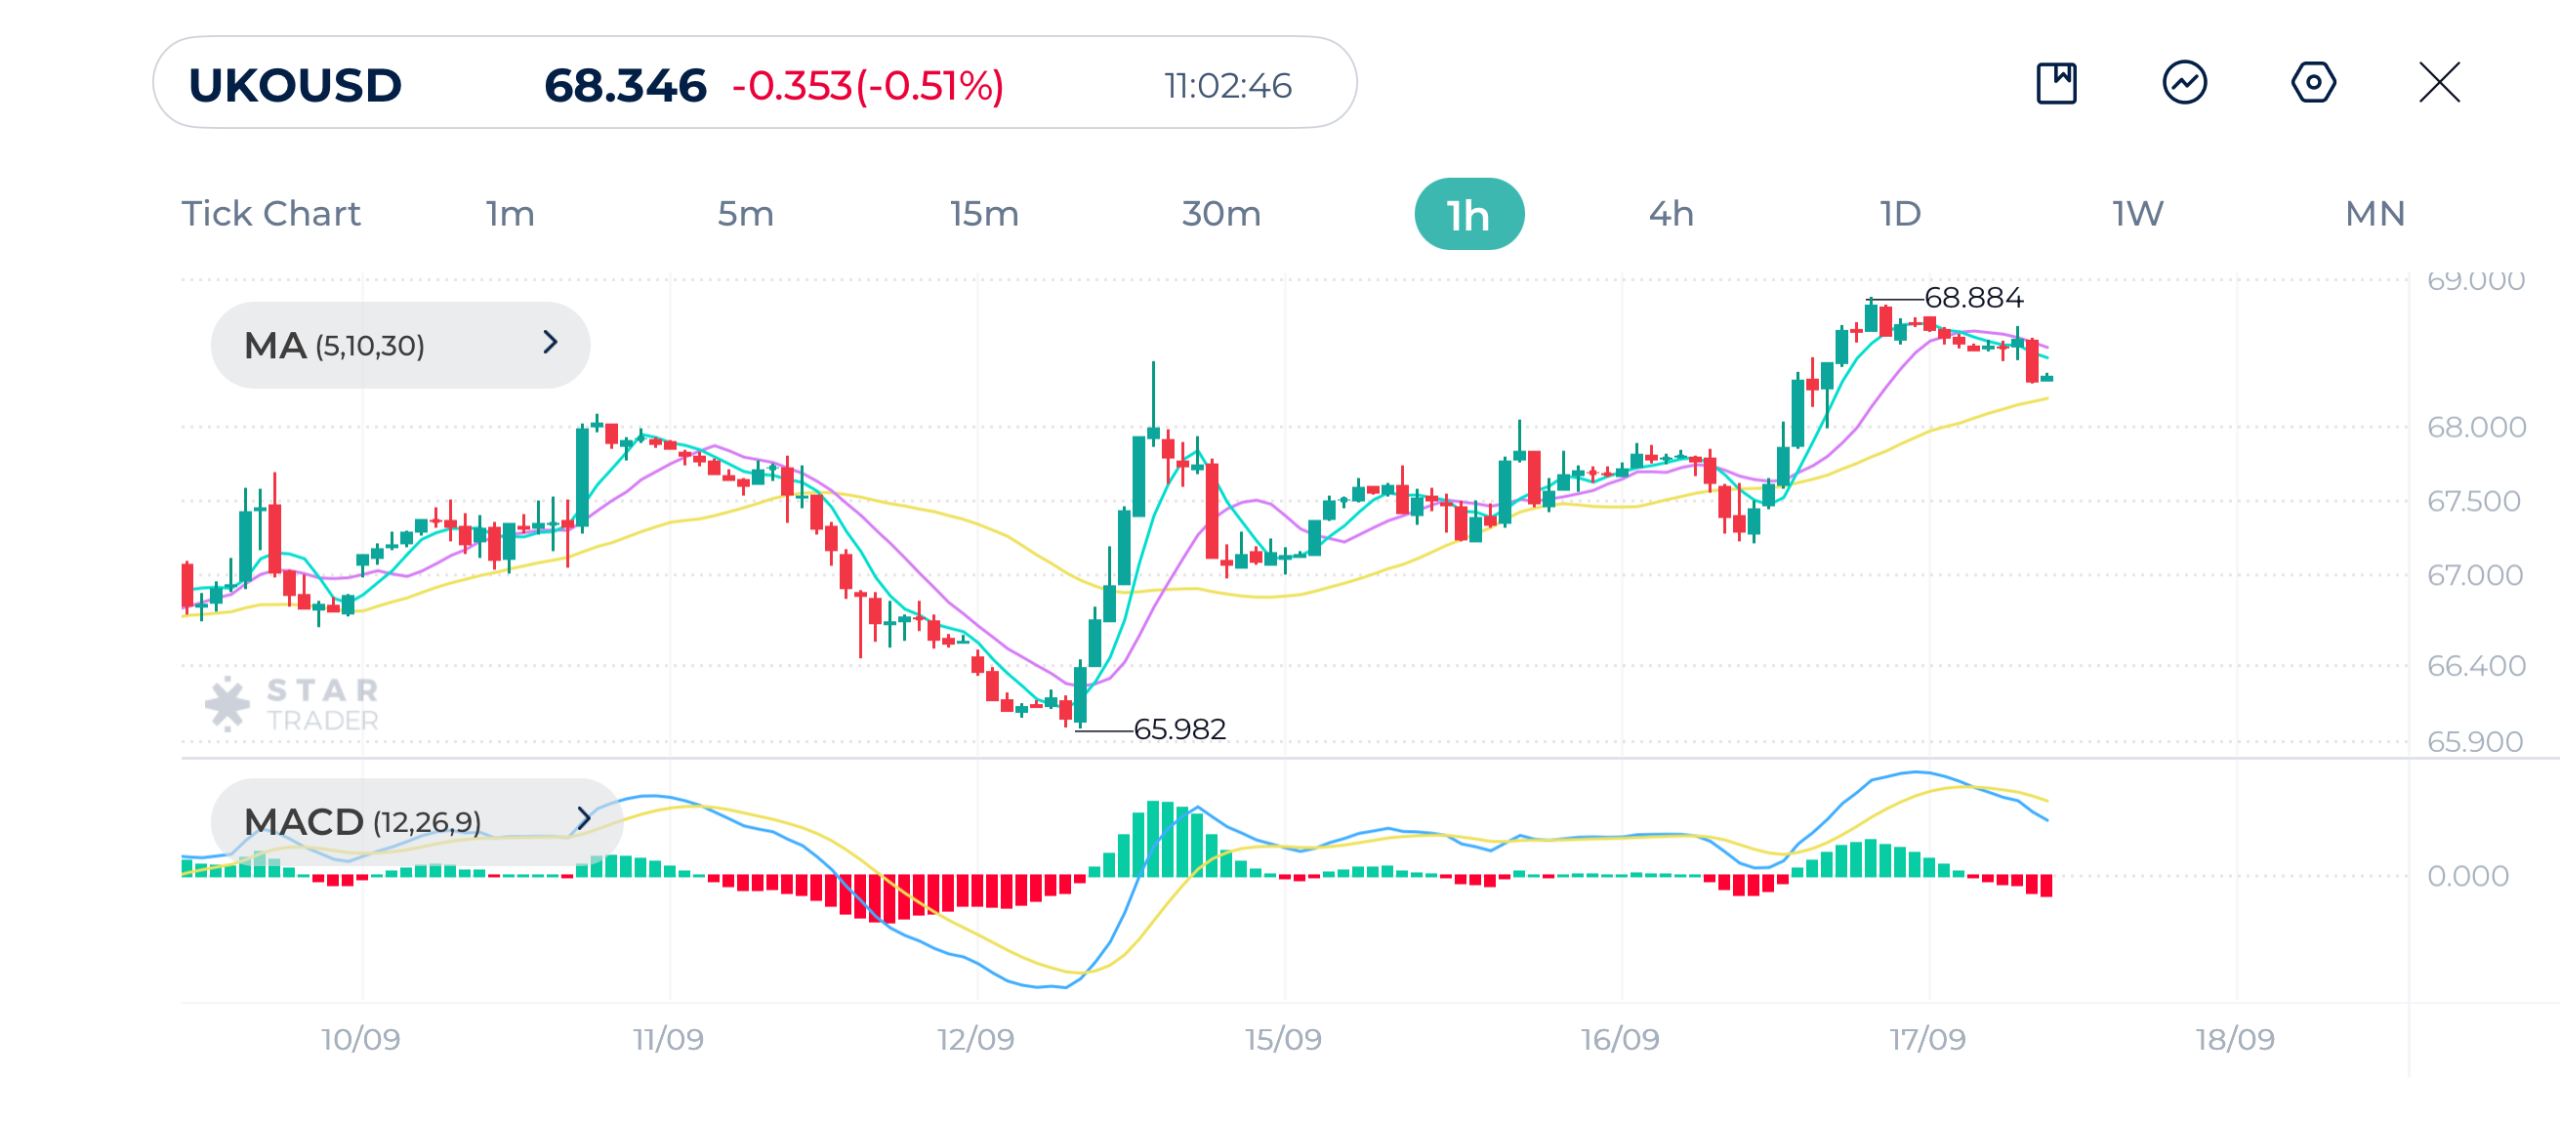
Brent 1H Chart
| Resistance | $68.14 | $68.35 | $69.00 |
| Support | $67.50 | $67.13 | $66.74 |
Tags
Open Live Account
Please enter a valid country
No results found
No results found
Please enter a valid email
Please enter a valid verification code
1. 8-16 characters + numbers (0-9) 2. blend of letters (A-Z, a-z) 3. special characters (e.g, !a#S%^&)
Please enter the correct format
Please tick the checkbox to proceed
Please tick the checkbox to proceed
Important Notice
STARTRADER does not accept any applications from Australian residents.
To comply with regulatory requirements, clicking the button will redirect you to the STARTRADER website operated by STARTRADER PRIME GLOBAL PTY LTD (ABN 65 156 005 668), an authorized Australian Financial Services Licence holder (AFSL no. 421210) regulated by the Australian Securities and Investments Commission.
CONTINUEImportant Notice for Residents of the United Arab Emirates
In alignment with local regulatory requirements, individuals residing in the United Arab Emirates are requested to proceed via our dedicated regional platform at startrader.ae, which is operated by STARTRADER Global Financial Consultation & Financial Analysis L.L.C.. This entity is licensed by the UAE Capital Market Authority (CMA) under License No. 20200000241, and is authorised to introduce financial services and promote financial products in the UAE.
Please click the "Continue" button below to be redirected.
CONTINUEError! Please try again.

