


Market News Summary
EURGBP

From the daily time frame, the overall trend for price in EURGBP looks bullish. Price currently reacting to a level of 0.8360 which is in confluence with the upward trend-line before a possible move to the bullish direction. Price is also in divergence with the RSI and MACD indicators.
PIVOT POINT: 0.8360
| S1 | S2 | S3 | |
| SUPPORT | 0.8315 | 0.8290 | 0.8260 |
| R1 | R2 | R3 | |
| RESISTANCE | 0.8410 | 0.8450 | 0.8510 |
WTI (US OIL)
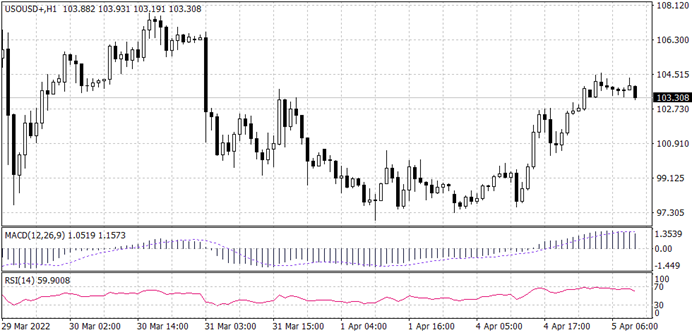
From the overview of price in WTI, the overall trend is bearish. Price is currently reacting to the resistance level of 103.70 forming a reversal pattern in the form of a rising wedge and in divergence with the RSI indicator for a possible push to the bearish direction.
PIVOT POINT: 103.75
| S1 | S2 | S3 | |
| SUPPORT | 107.10 | 110.30 | 113.25 |
| R1 | R2 | R3 | |
| RESISTANCE | 100.40 | 97.70 | 92.60 |
USDCAD
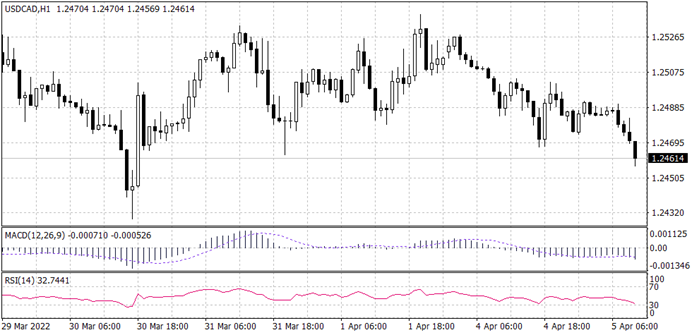
From the overview of the price of USDCAD, the price is reacting to the resistance level of 1.2465 thereby forming an inverted head and shoulder pattern, and the RSI in divergence with the price of a falling wedge at that level.
PIVOT POINT: 1.2465
| S1 | S2 | S3 | |
| SUPPORT | 1.2420 | 1.2370 | 1.2308 |
| R1 | R2 | R3 | |
| RESISTANCE | 1.2560 | 1.2620 | 1.2690 |
Spot GOLD (XAUUSD)
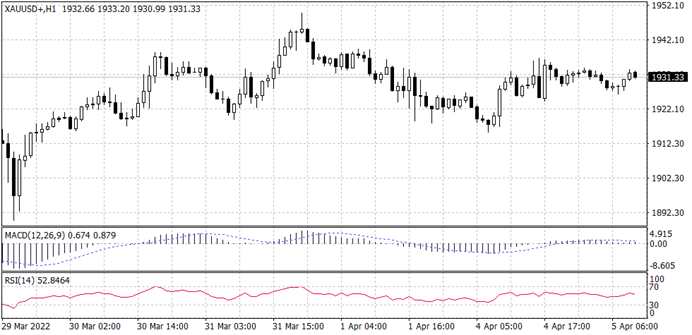
Spot gold has been moving in the same range on the 4-hour time frame after an initial impulsive move to the bearish direction. However, the hourly time frame, price is forming higher highs after an initial breakout from the downward trend-line, while Price has formed a rejection in form of a pin-bar at the support level of 1,925 and is above the centre-line on the RSI and MACD indicators.
PIVOT POINT: 1925.0
| S1 | S2 | S3 | |
| SUPPORT | 1940 | 1950 | 1960 |
| R1 | R2 | R3 | |
| RESISTANCE | 1920 | 1910 | 1900 |
NASDAQ 100 (NAS100)
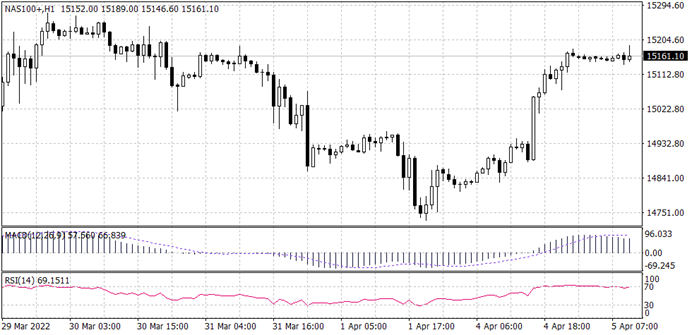
From the overview of price in NAS 100, the overall bias is bullish seeing price making higher highs. Price is currently within the resistance level of 15,250 and may likely pull back to the support level of 14,960 before continuing in its bullish momentum. Additionally, the RSI and MACD are above the centre-line signaling a downtrend.
PIVOT POINT: 15250
| S1 | S2 | S3 | |
| SUPPORT | 14960 | 14700 | 14420 |
| R1 | R2 | R3 | |
| RESISTANCE | 15590 | 16000 | 16420 |
EURUSD
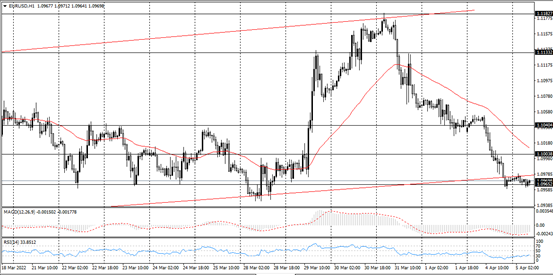
The overall trend for EURUSD is bearish. Price has formed a bearish continuation flag from the daily time frame after an impulsive move to the bearish direction. Down to the hourly time frame, the price is currently at the upward trendline and resistance level of 1.0965 which is also in divergence with the RSI which may push the price to a bearish direction. However, the price may break out of the flag to continue in its bearish momentum.
PIVOT POINT: 1.0965
| S1 | S2 | S3 | |
| SUPPORT | 1.1005 | 1.1040 | 1.1070 |
| R1 | R2 | R3 | |
| RESISTANCE | 1.0900 | 1.0850 | 1.0800 |
Tags
Open Live Account
Please enter a valid country
No results found
No results found
Please enter a valid email
Please enter a valid verification code
1. 8-16 characters + numbers (0-9) 2. blend of letters (A-Z, a-z) 3. special characters (e.g, !a#S%^&)
Please enter the correct format
Please tick the checkbox to proceed
Please tick the checkbox to proceed
Important Notice
STARTRADER does not accept any applications from Australian residents.
To comply with regulatory requirements, clicking the button will redirect you to the STARTRADER website operated by STARTRADER PRIME GLOBAL PTY LTD (ABN 65 156 005 668), an authorized Australian Financial Services Licence holder (AFSL no. 421210) regulated by the Australian Securities and Investments Commission.
CONTINUEImportant Notice for Residents of the United Arab Emirates
In alignment with local regulatory requirements, individuals residing in the United Arab Emirates are requested to proceed via our dedicated regional platform at startrader.ae, which is operated by STARTRADER Global Financial Consultation & Financial Analysis L.L.C.. This entity is licensed by the UAE Capital Market Authority (CMA) under License No. 20200000241, and is authorised to introduce financial services and promote financial products in the UAE.
Please click the "Continue" button below to be redirected.
CONTINUEError! Please try again.

