


Market News Summary
USDCHF
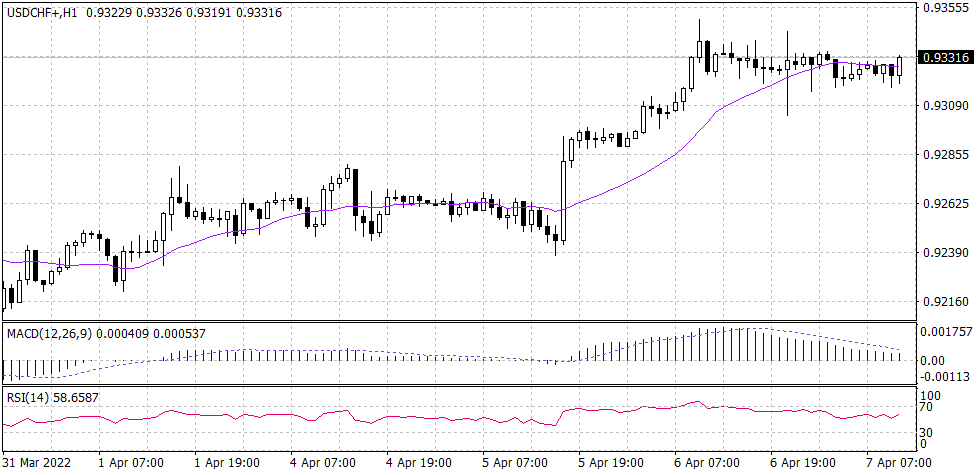
The overall trend from the daily time frame for USDCHF remains bullish. From the hourly time frame, it is also seen clearly that the price has been making a series of higher highs and is currently at 0.9330. There is a possibility of the price retesting the support level of 0.9300 before continuing in its bullish direction. The RSI is above the centre-line which adds to the movement of price to the upside.
PIVOT POINT: 0.9335
| S1 | S2 | S3 | |
| SUPPORT | 0.9295 | 0.9270 | 0.9240 |
| R1 | R2 | R3 | |
| RESISTANCE | 0.9370 | 0.9390 | 0.9420 |
WTI (US OIL)
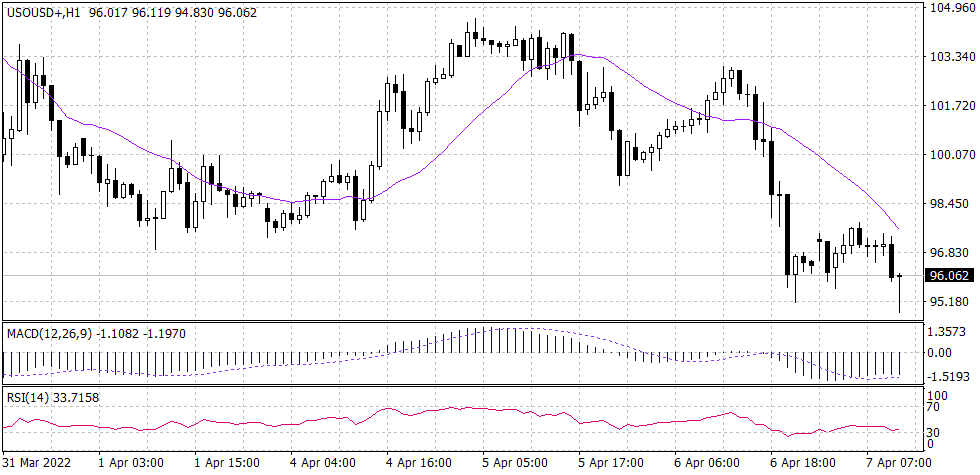
From the daily time frame of WTI (US OIL), the trend is bearish. Price has made a pullback or a corrective move to the level of $97.60 a barrel. There is a possible retest of the 20-period moving average level at 97.59 before the price continues to the downside. The RSI is below the centre-line which indicates a possible bearish momentum of price to the downside.
PIVOT POINT: 97.60
| S1 | S2 | S3 | |
| SUPPORT | 92.600 | 90.05 | 87.60 |
| R1 | R2 | R3 | |
| RESISTANCE | 99.34 | 103.40 | 107.10 |
BTCUSD
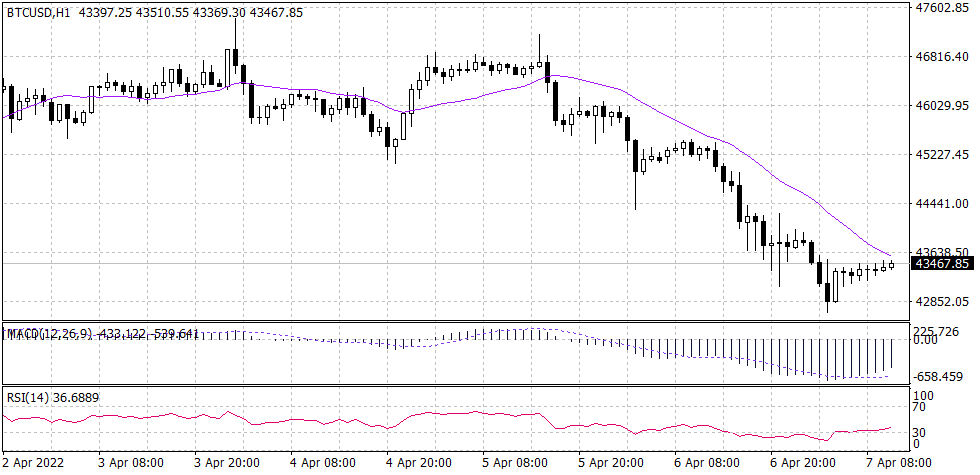
From the overview of the price on the daily time frame, the price of Bitcoin looks bullish. However, from the hourly time frame, the price has been making a series of lower lows to the downside. Price is currently making a pullback to the 20 period MA at the level of 43,660 which is likely to push down the price in the bearish direction. The RSI and MACD both show a corrective move of price to the level of 43,660.
PIVOT POINT: 43,660
| S1 | S2 | S3 | |
| SUPPORT | 42,700 | 41,945 | 41,320 |
| R1 | R2 | R3 | |
| RESISTANCE | 44,395 | 45,090 | 45,650 |
EURUSD
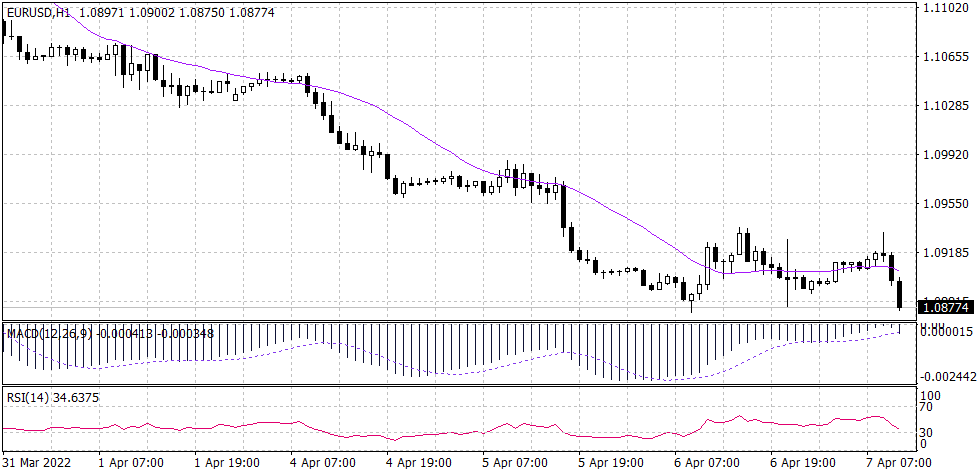
EURUSD is in an overall bearish trend from the daily frame. Similarly, on the hourly time frame price has been making a series of lower lows to the downside and is currently within the 0.8940 level. There is a likelihood of price going lower as is seen in the RSI and MACD indicator which shows price is in bearish momentum.
PIVOT POINT: 1.0940
| S1 | S2 | S3 | |
| SUPPORT | 1.0890 | 1.0850 | 1.0805 |
| R1 | R2 | R3 | |
| RESISTANCE | 1.0980 | 1.1030 | 1.1060 |
Dow Jones (US 30)
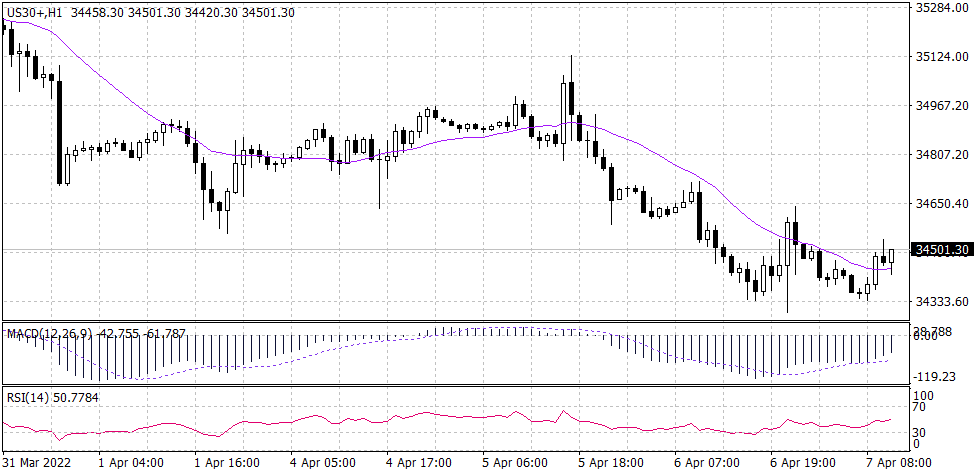
From the overview of the price of the Dow Jones (US 30), the daily time frame shows a bullish trend. Price has made a rebound around the 34,330 level which has an intersection between the upward trend-line and downward trend-line respectively. The RSI and MACD both show a rejection of price around 34,330.
PIVOT POINT: 34,330
| S1 | S2 | S3 | |
| SUPPORT | 34,165 | 33,940 | 33,700 |
| R1 | R2 | R3 | |
| RESISTANCE | 34,590 | 34,720 | 34,960 |
Tags
Open Live Account
Please enter a valid country
No results found
No results found
Please enter a valid email
Please enter a valid verification code
1. 8-16 characters + numbers (0-9) 2. blend of letters (A-Z, a-z) 3. special characters (e.g, !a#S%^&)
Please enter the correct format
Please tick the checkbox to proceed
Please tick the checkbox to proceed
Important Notice
STARTRADER does not accept any applications from Australian residents.
To comply with regulatory requirements, clicking the button will redirect you to the STARTRADER website operated by STARTRADER PRIME GLOBAL PTY LTD (ABN 65 156 005 668), an authorized Australian Financial Services Licence holder (AFSL no. 421210) regulated by the Australian Securities and Investments Commission.
CONTINUEImportant Notice for Residents of the United Arab Emirates
In alignment with local regulatory requirements, individuals residing in the United Arab Emirates are requested to proceed via our dedicated regional platform at startrader.ae, which is operated by STARTRADER Global Financial Consultation & Financial Analysis L.L.C.. This entity is licensed by the UAE Capital Market Authority (CMA) under License No. 20200000241, and is authorised to introduce financial services and promote financial products in the UAE.
Please click the "Continue" button below to be redirected.
CONTINUEError! Please try again.

