


Market news summary
US INDEX
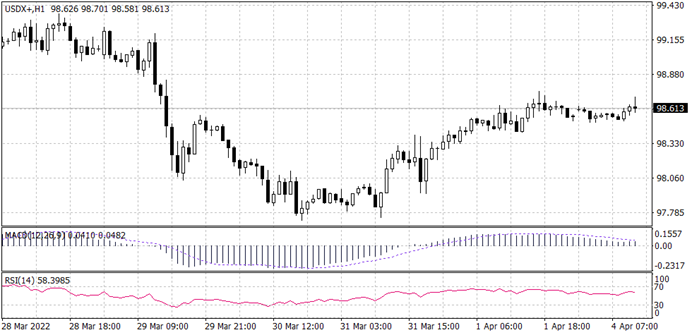
From the higher time frame, the overall trend for US INDEX is bullish. Down to the hourly time frame price seems to be in a range after an initial impulsive move in the bullish direction as the 200 EMA is moving in between prices. Price is currently retesting a minor support level of 98.50 which is in confluence with the retest of the 200EMA. The RSI and MACD are above the centre-line for price continuation in the bullish direction.
PIVOT POINT: 98.50
| S1 | S2 | S3 | |
|---|---|---|---|
| SUPPORT | 98.50 | 97.70 | 97.30 |
| R1 | R2 | R3 | |
| RESISTANCE | 98.90 | 99.30 | 99.85 |
GBPUSD
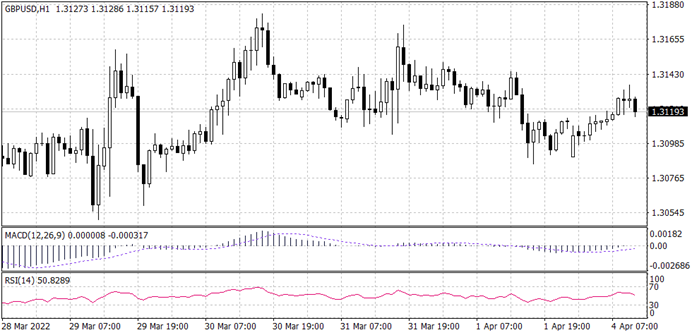
From the overview of price in GBPUSD, the trend looks bearish. Price is trading below the 200 EMA and has also broken the upward trend line and is about to retest the trend-line which is in confluence with the support level of 1.3145 before continuing bearish. The MACD is below the centre-line for a possible price continuation in the bearish direction.
PIVOT POINT: 1.3145
| S1 | S2 | S3 | |
| SUPPORT | 1.3145 | 1.3175 | 1.3220 |
| R1 | R2 | R3 | |
| RESISTANCE | 1.3120 | 1.3090 | 1.3060 |
USDJPY
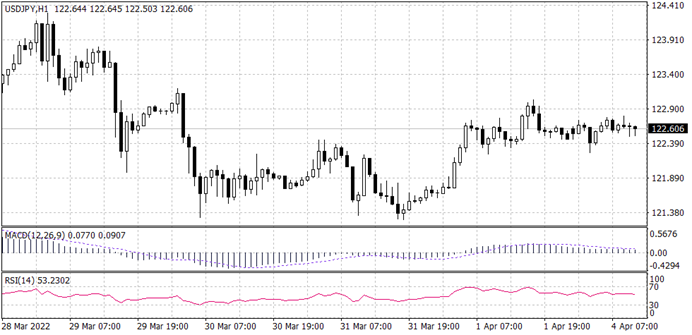
From the overview of price in USDJPY, the overall trend looks bullish. Price is trading above the 200 EMA, and it is currently retesting the support level of 122.30. The RSI and MACD are above the centre-line which indicates price continuation in the bullish direction.
PIVOT POINT: 122.35
| S1 | S2 | S3 | |
| SUPPORT | 122.35 | 121.30 | 120.60 |
| R1 | R2 | R3 | |
| RESISTANCE | 123.20 | 123.8- | 124.30 |
WTI (US OIL)
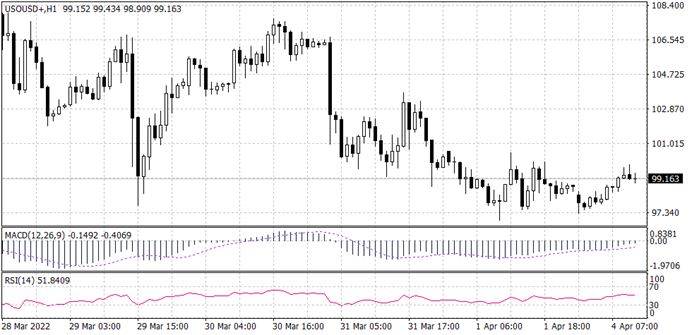
From the overview of price in WITI, the overall trend looks bearish. Price is testing the resistance level of 98.40 which is making a counter-trend move to the support level of 103.35. There seem to be confluences between the downward trend-line and 200 EMA at the support level of 103.35,
PIVOT POINT: 103.35
| S1 | S2 | S3 | |
| SUPPORT | 100.10 | 103.35 | 107.10 |
| R1 | R2 | R3 | |
| RESISTANCE | 97.80 | 92.60 | 90.10 |
ETHUSD
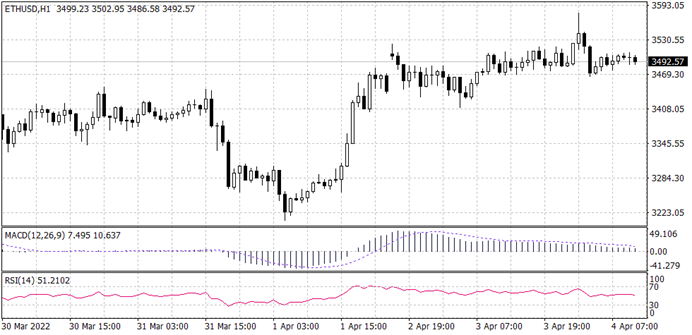
From the overview of the price in ETHUSD, the overall trend looks bullish as the price is trading below the 200 EMA. The price is currently within the support level of 3,475, which may possibly push the price in a bullish direction. The MACD and RSI are within the center-line.
PIVOT POINT: 3413
| S1 | S2 | S3 | |
| SUPPORT | 3475 | 3413 | 3260 |
| R1 | R2 | R3 | |
| RESISTANCE | 3640 | 3755 | 3895 |
BTCUSD
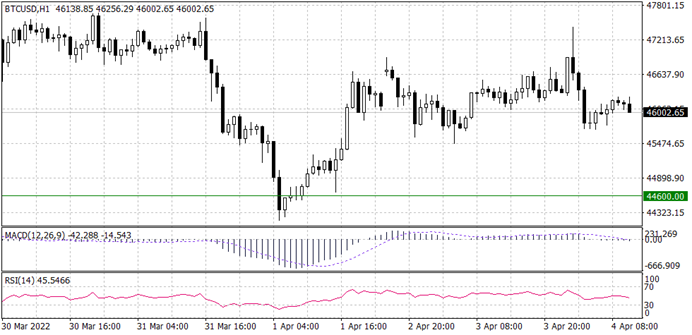
From the overview of the price in BTCUSD, the trend looks bullish as the price is trading below the 200 EMA. Price is currently retesting the support level of 45,700 which is also in confluence with the 200 EMA before the price continues bullish. The MACD and RSI are above the centre-line.
PIVOT POINT: 45700
| S1 | S2 | S3 | |
| SUPPORT | 45700 | 44880 | 42210 |
| R1 | R2 | R3 | |
| RESISTANCE | 46900 | 48080 | 49730 |
GOLD SPOT (XAUUSD)
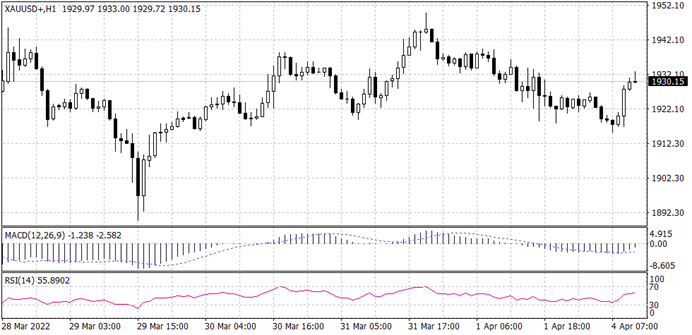
From the overview of price in XAUUSD, the price seems to be in consolidation after refusing to make any significant move to either the bullish or bearish direction. From the hourly timeframe, the price seems to break the downward trendline to the upside which may result in a possible pullback to the support level of 1,930 before pushing to the bullish direction.
PIVOT POINT: 1925
| S1 | S2 | S3 | |
| SUPPORT | 1925 | 1920 | 1910 |
| R1 | R2 | R3 | |
| RESISTANCE | 1930 | 1945 | 1960 |
Tags
Open Live Account
Please enter a valid country
No results found
No results found
Please enter a valid email
Please enter a valid verification code
1. 8-16 characters + numbers (0-9) 2. blend of letters (A-Z, a-z) 3. special characters (e.g, !a#S%^&)
Please enter the correct format
Please tick the checkbox to proceed
Please tick the checkbox to proceed
Important Notice
STARTRADER does not accept any applications from Australian residents.
To comply with regulatory requirements, clicking the button will redirect you to the STARTRADER website operated by STARTRADER PRIME GLOBAL PTY LTD (ABN 65 156 005 668), an authorized Australian Financial Services Licence holder (AFSL no. 421210) regulated by the Australian Securities and Investments Commission.
CONTINUEImportant Notice for Residents of the United Arab Emirates
In alignment with local regulatory requirements, individuals residing in the United Arab Emirates are requested to proceed via our dedicated regional platform at startrader.ae, which is operated by STARTRADER Global Financial Consultation & Financial Analysis L.L.C.. This entity is licensed by the UAE Capital Market Authority (CMA) under License No. 20200000241, and is authorised to introduce financial services and promote financial products in the UAE.
Please click the "Continue" button below to be redirected.
CONTINUEError! Please try again.

