








 Web Trader MT5













Nikkei Technical Analysis
The Nikkei 225 is moving in a strong bullish trend, reaching a new high above 50,500. The recent rally shows strong momentum, and candles are consistently closing above the short-term moving averages MA(5) and MA(10). The bullish direction on the 30-period moving average confirms that demand is helping sustain the rally.
MACD is above zero with widening separation, indicating that buyers remain fully in control, although the rally is slightly over-extended, meaning a corrective pause is normal from the current levels.
The outlook for Nikkei indicates a strong bullish trend. A pull-back toward MA(10) and MA(30) are likely before continuing the uptrend.
Nikkei 1H Chart
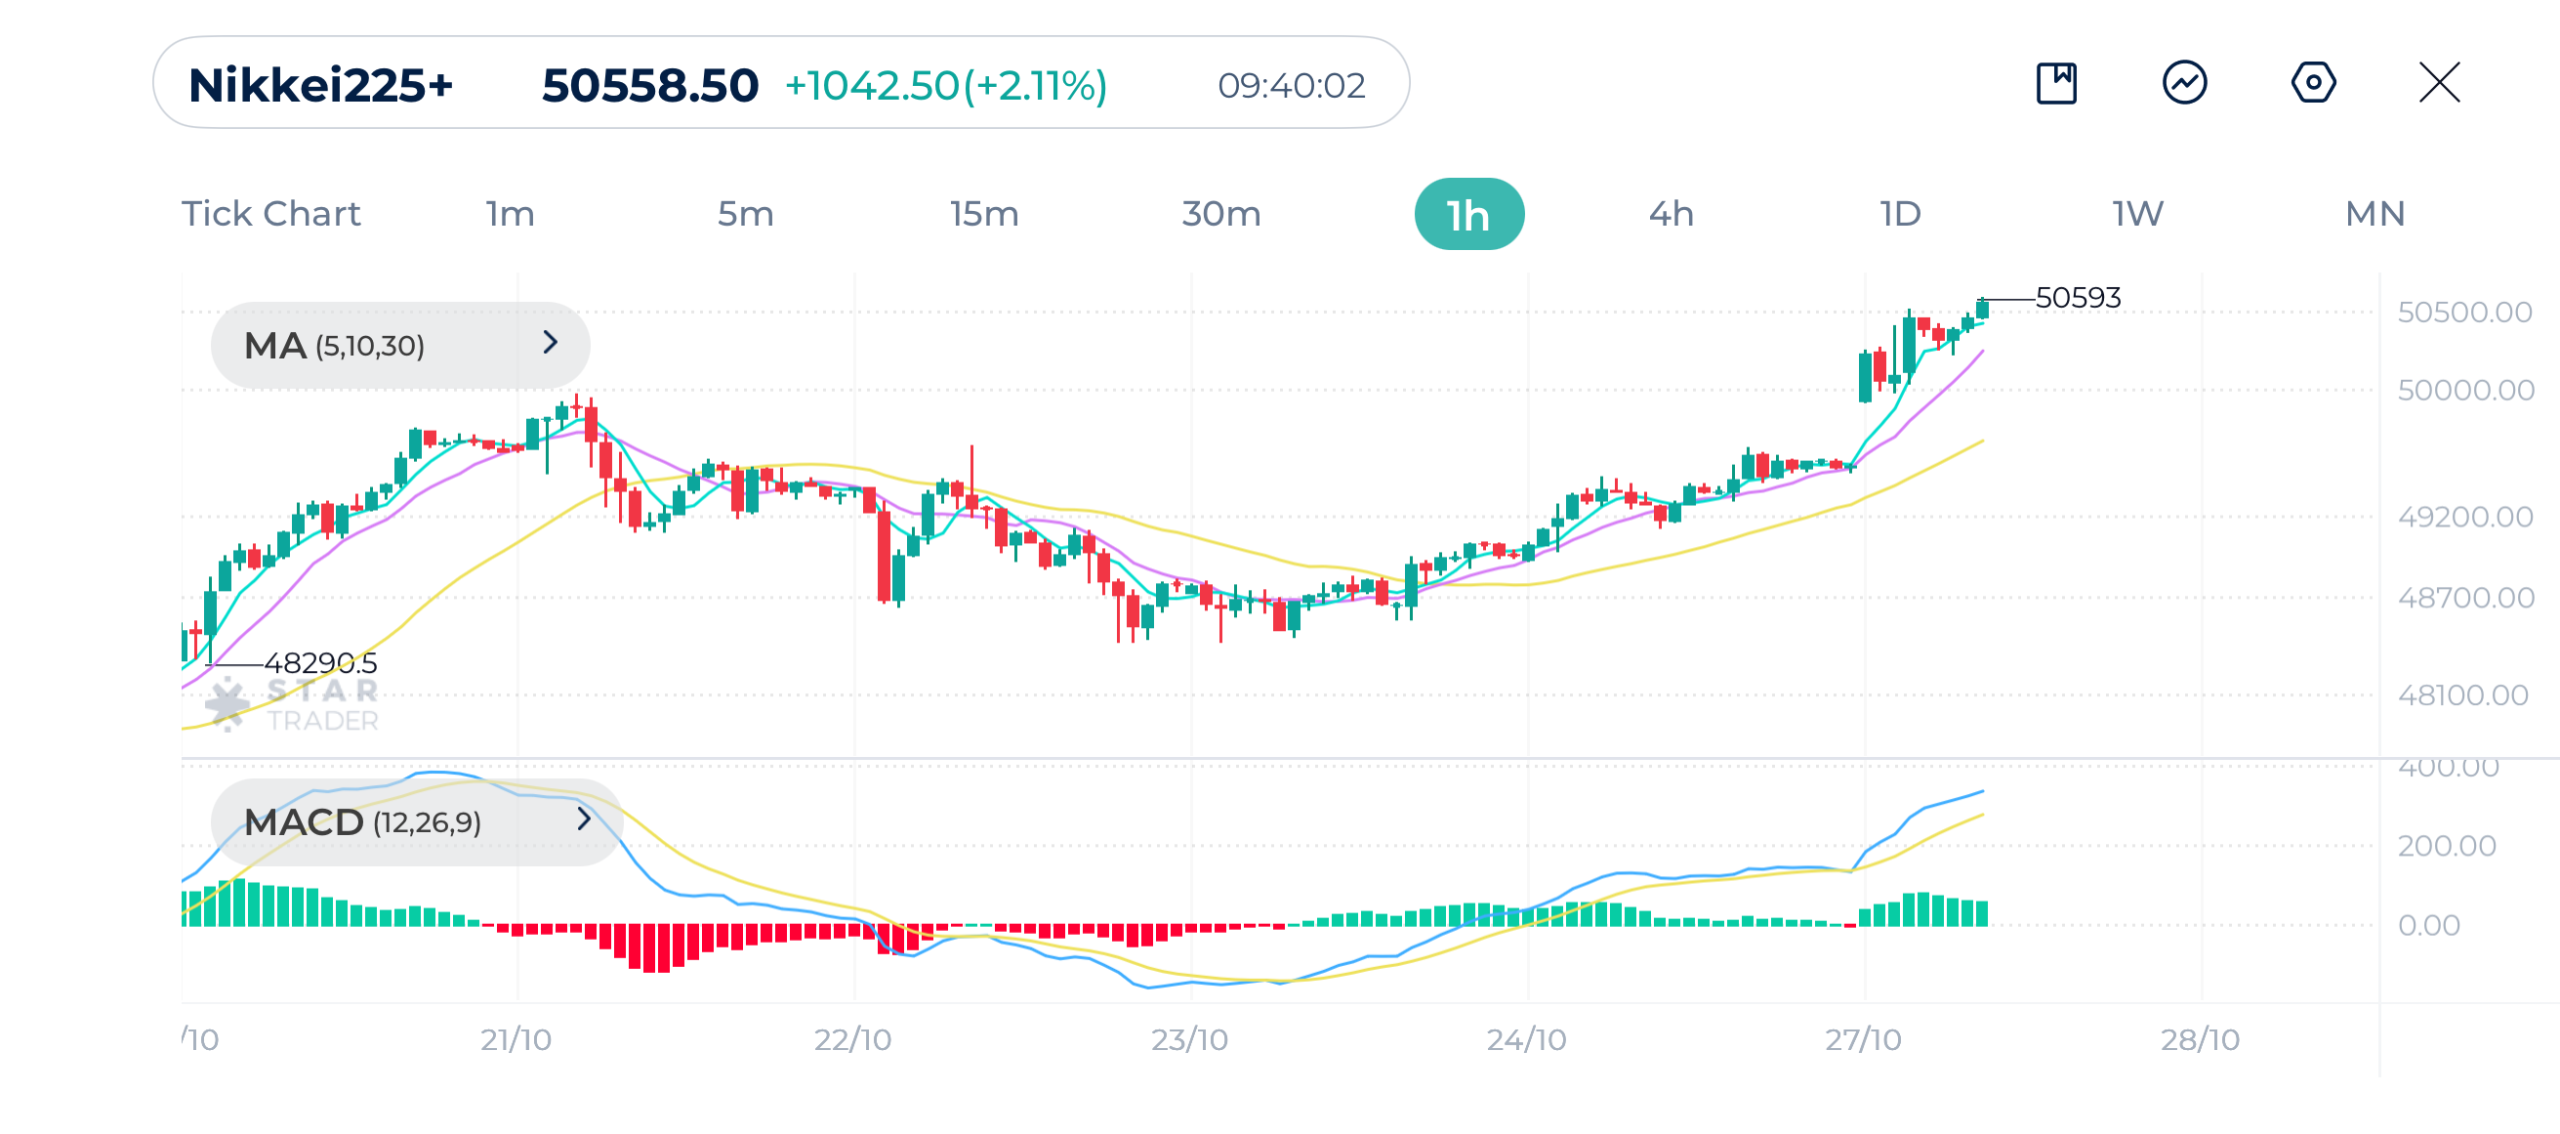
| Resistance | 50,750 | 51,050 | 51,200 |
| Support | 50,200 | 49,859 | 49,446 |
Brent Technical Analysis
Brent is currently showing a clear bullish recovery from the recent low near $60.20 earlier in the month. Price has sharply moved higher and is now consolidating near $66.40–$66.80 as it faces resistance at $67.00 levels.
Recent candles on the 4H chart show smaller bodies, indicating buying momentum is slowing. The short-term moving averages MA(5) and MA(10) are still above the 30-period moving average, confirming the continuation of the uptrend structure.
MACD shows momentum has recently peaked as the MACD line is close to signaling a bearish crossover. This confirms that bulls are losing some strength, and price may look to retest nearby moving averages before any new breakout attempt.
Bullish trend in the short-term may be reaching an end since the overall trend in the longer term is bearish. We can expect a pullback before higher continuation. However, a break above $68.00 could push prices higher toward $69.00 and $70.00.
Brent 1H Chart
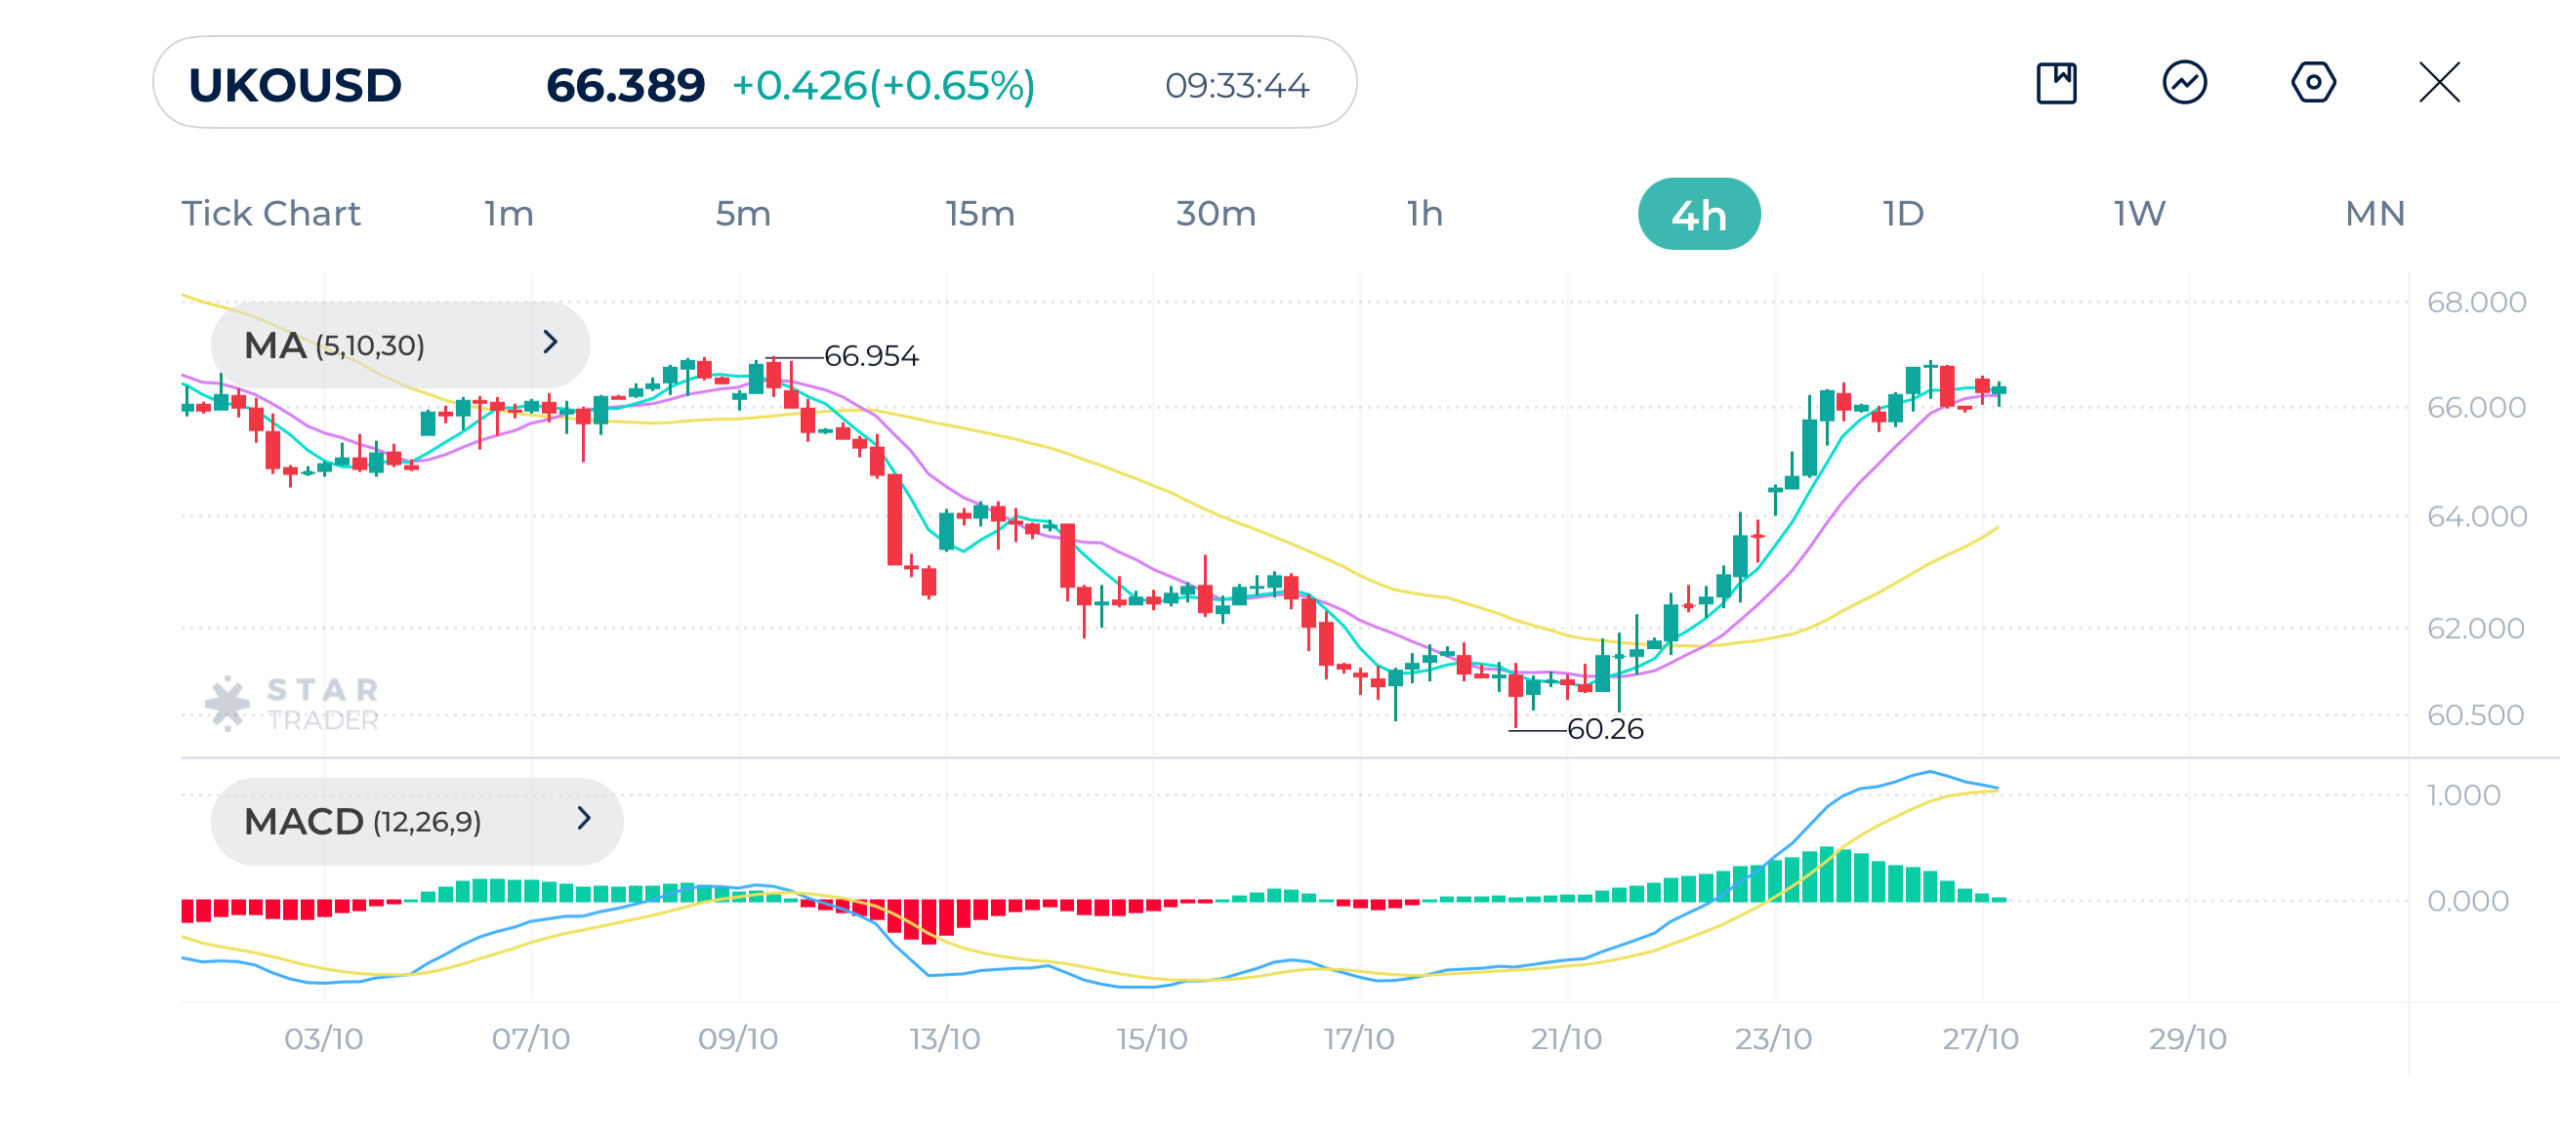
| Resistance | $66.00 | $66.78 | $67.50 |
| Support | $65.00 | $64.50 | $63.87 |
Bitcoin Technical Analysis
Bitcoin continues to hold a strong bullish structure after breaking out above $111,000, now trading around $115,000–$116,000. The price action is showing clean higher highs and lows, and candles remain above the short-term moving averages MA(5) and MA(10), which shows aggressive short-term buying strength.
MACD indicates continuing bullish momentum with the MACD line well above the signal line. However, price is currently extended, suggesting a possible correction soon, but still within a strong uptrend.
Trend is strongly bullish on the 1H chart. A correction to dynamic support levels of MA(5) and MA(10) is likely before another leg up.
Bitcoin 1H Chart
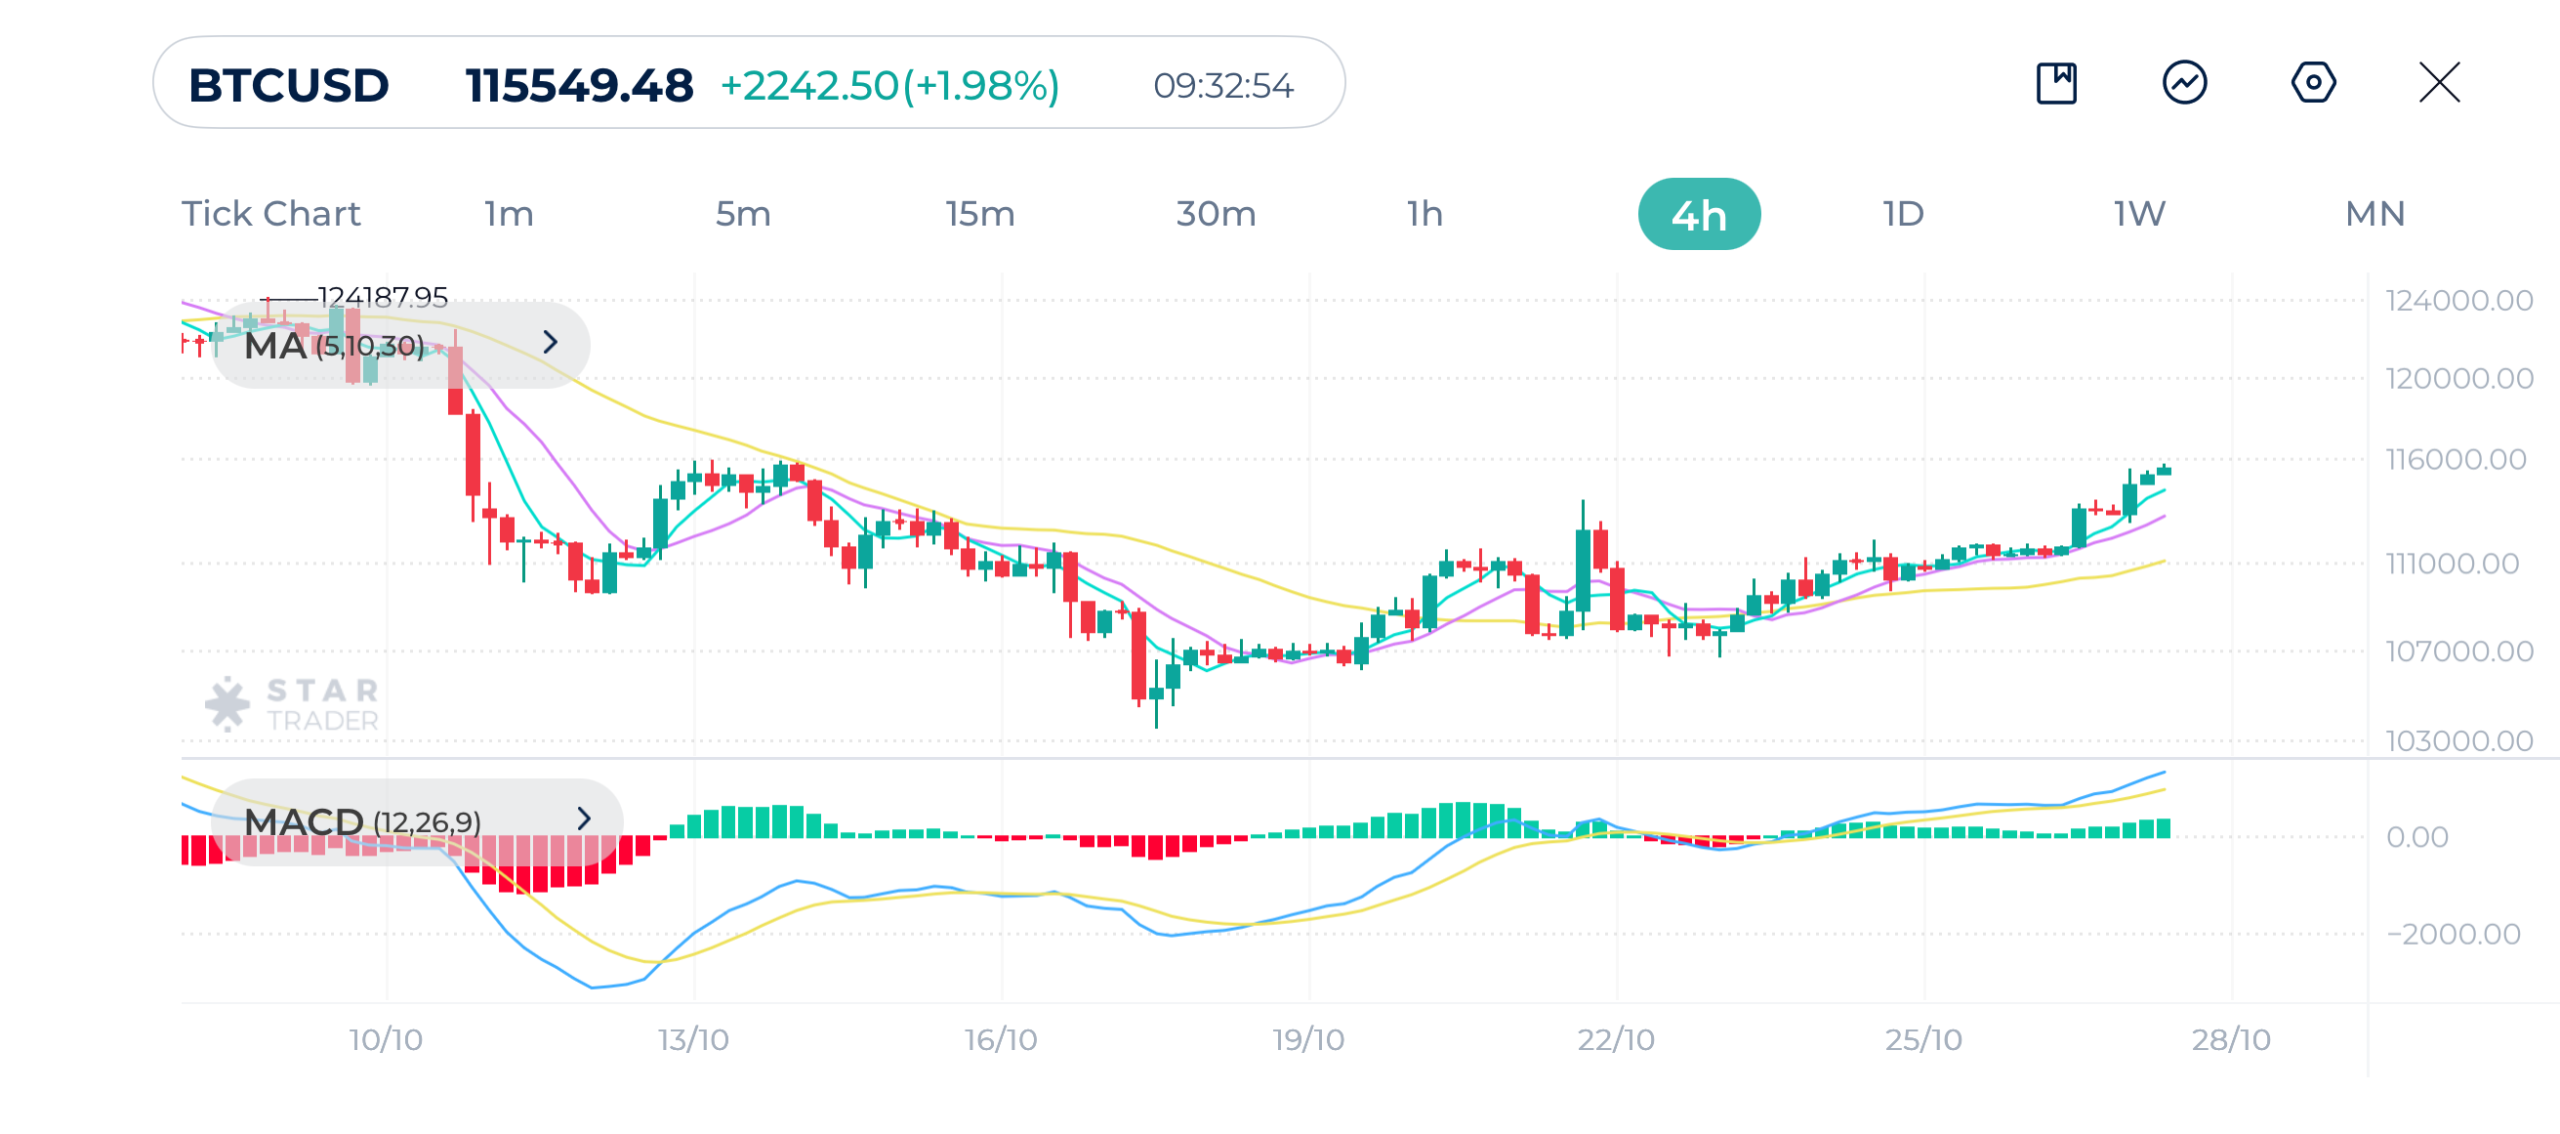
| Resistance | $116,100 | $118,000 | $119,700 |
| Support | $114,400 | $113,700 | $112,553 |
Tags


Open Live Account
 Email Address
 Phone Number
Important Notice
STARTRADER does not accept any applications from Australian residents.
To comply with regulatory requirements, clicking the button will redirect you to the STARTRADER website operated by STARTRADER PRIME GLOBAL PTY LTD (ABN 65 156 005 668), an authorized Australian Financial Services Licence holder (AFSL no. 421210) regulated by the Australian Securities and Investments Commission.
Important Notice for Residents of the United Arab Emirates
In alignment with local regulatory requirements, individuals residing in the United Arab Emirates are requested to proceed via our dedicated regional platform at startrader.ae, which is operated by STARTRADER Global Financial Consultation & Financial Analysis L.L.C.. This entity is licensed by the UAE Capital Market Authority (CMA) under License No. 20200000241, and is authorised to introduce financial services and promote financial products in the UAE.
Please click the "Continue" button below to be redirected.


