








 Web Trader MT5













USDJPY Technical Analysis
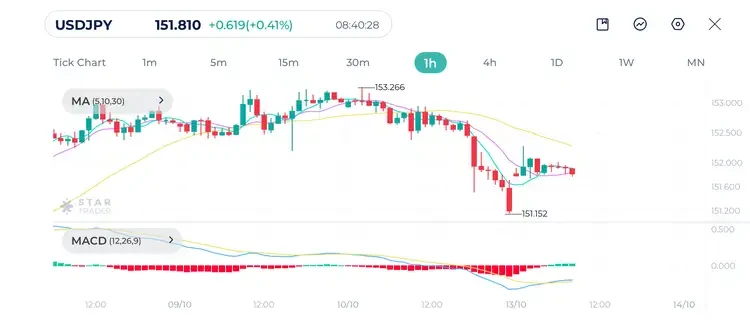
USDJPY experienced a sharp intraday drop on Friday, marking a near 200-pip correction. The moving averages (5 and 10) have crossed below the 30-period MA, confirming a short-term bearish momentum.
Price has recovered since and broke above 152.00 zone.
MACD shows a bullish crossover in play, but price action confirmation is needed to indicate a bullish reversal. A potential bullish crossover could form soon if price stabilizes above 151.80.
If USDJPY holds above 151.80, it could attempt a short-term rebound toward 152.50. However, a break below 151.15 would reopen the path toward 150.80–150.50.
USDJPY 1H Chart
| Resistance | 152.28 | 152.76 | 153.28 |
| Support | 151.74 | 151.24 | 150.75 |
Silver Technical Analysis
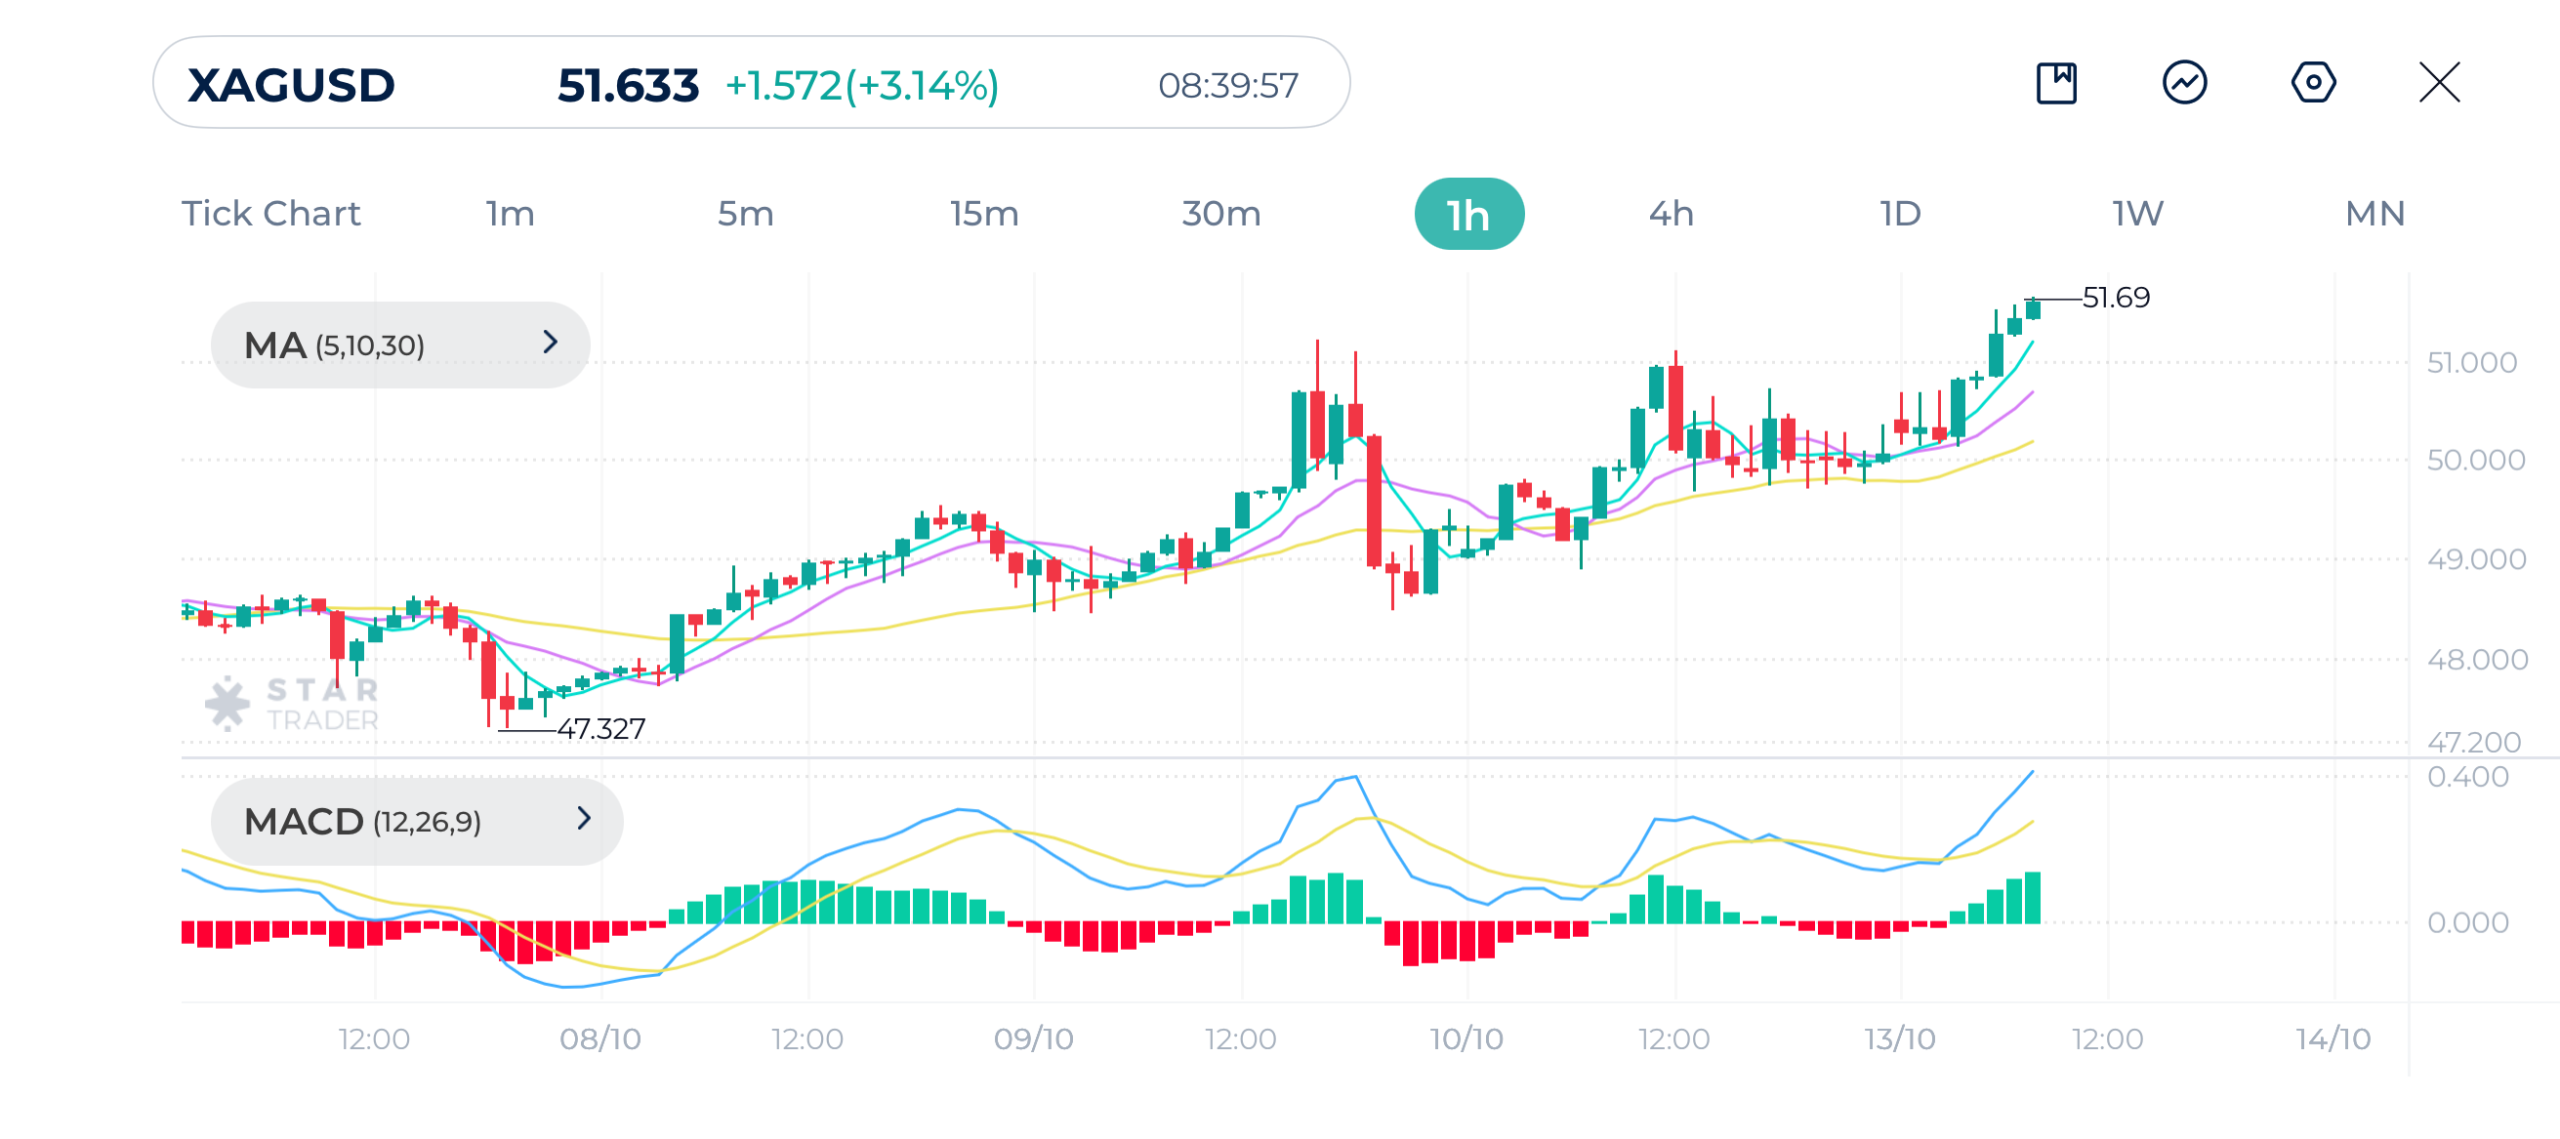
Silver maintains its strong rally, gaining over 3% since the market opened today.
The short-term moving averages (5 & 10) are well above the 30-period moving average, showing strong bullish momentum. The breakout above 51.00 resistance confirms renewed buying interest.
MACD line has crossed above the signal line, which supports bullish continuation. Momentum is strong, with no signs of divergence yet.
Momentum and moving averages both support further upside potential toward $52.00–$52.30.
However, traders should watch for potential overextension or short-term pullback if MACD histogram peaks sharply.
Silver 1H Chart
| Resistance | $52.00 | $52.40 | $52.75 |
| Support | $51.12 | $50.10 | $49.66 |
Nasdaq 100 Technical Analysis
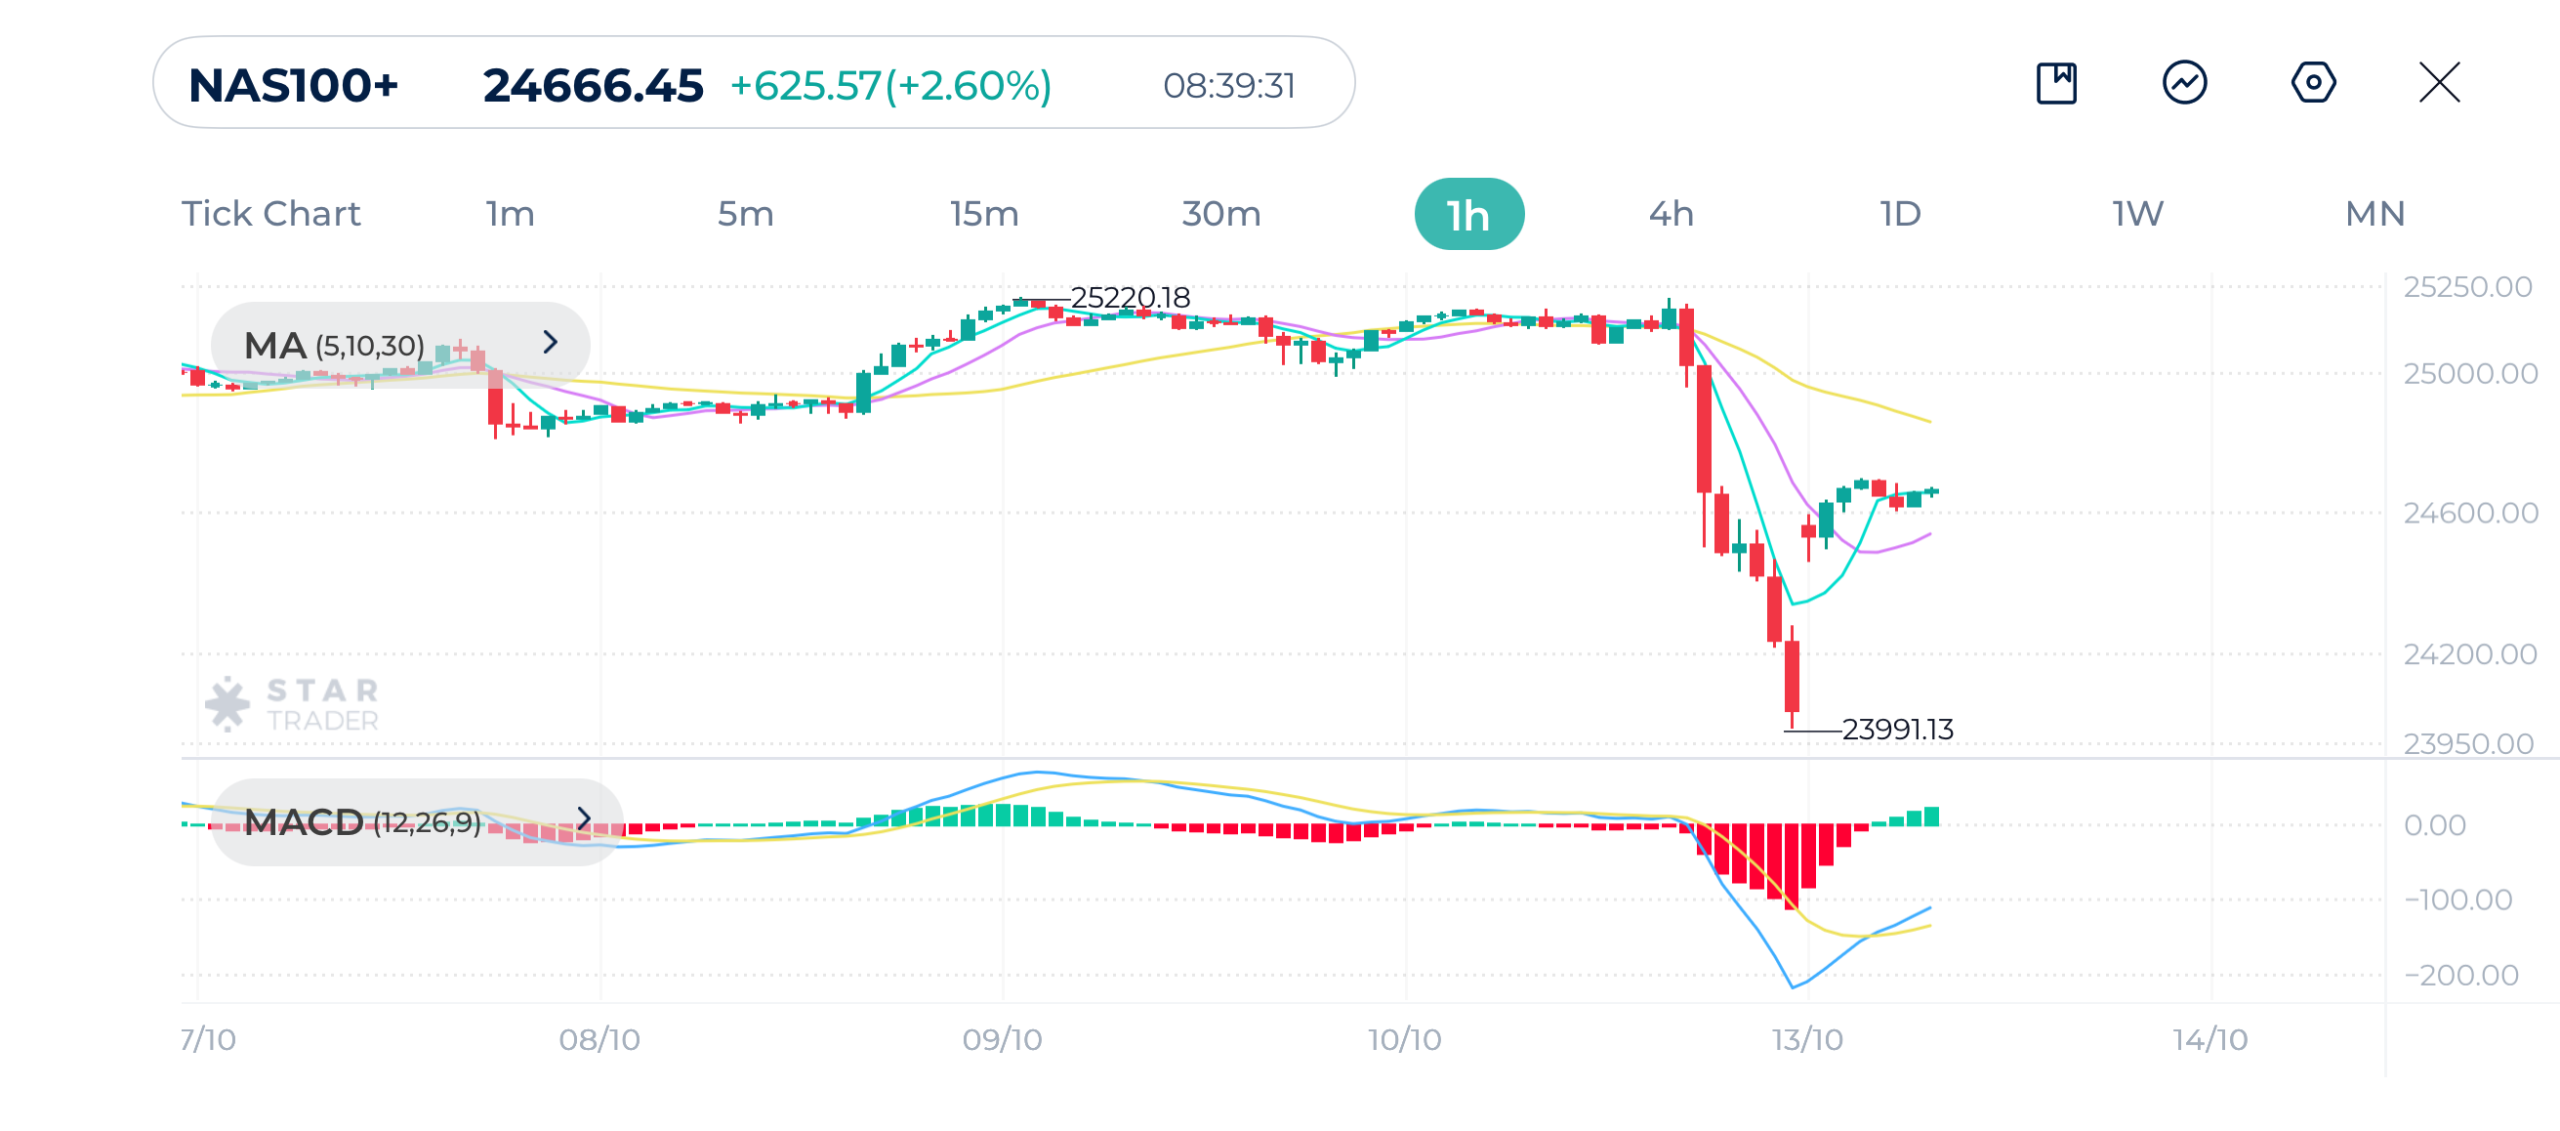
Nasdaq 100 rebounded strongly after touching 23,991 support, a level that marks a double-bottom on the 1H chart. The 5 and 10 moving averages have started turning upward, but price still trades below the 30-period moving average, showing an early recovery phase. The large bullish candles after the sharp drop signal buyers regaining control.
MACD shows a bullish crossover, confirming momentum reversal. The recovery from deeply negative territory suggests potential for continuation toward 24,800–25,000.
The short-term momentum is bullish, supported by MACD crossover and buying volume.
If price breaks above 24,800, it could resume the rally toward 25,200–25,500. However, falling back below 24,200 would invalidate the recovery setup.
Nasdaq 100 1H Chart
| Resistance | 24,681 | 24,782 | 25,000 |
| Support | 24,480 | 24,278 | 23,973 |
Tags


Open Live Account
 Email Address
 Phone Number
Important Notice
STARTRADER does not accept any applications from Australian residents.
To comply with regulatory requirements, clicking the button will redirect you to the STARTRADER website operated by STARTRADER PRIME GLOBAL PTY LTD (ABN 65 156 005 668), an authorized Australian Financial Services Licence holder (AFSL no. 421210) regulated by the Australian Securities and Investments Commission.
Important Notice for Residents of the United Arab Emirates
In alignment with local regulatory requirements, individuals residing in the United Arab Emirates are requested to proceed via our dedicated regional platform at startrader.ae, which is operated by STARTRADER Global Financial Consultation & Financial Analysis L.L.C.. This entity is licensed by the UAE Capital Market Authority (CMA) under License No. 20200000241, and is authorised to introduce financial services and promote financial products in the UAE.
Please click the "Continue" button below to be redirected.


