


Bitcoin Technical Analysis
Bitcoin is continuing its downtrend from the recent high near $95,000. Price found support at approximately $85,149, where a double bottom on the hourly chart seems to be forming.
The price is well below the yellow 30-period moving average. However, it’s starting to move sideways.
A bullish convergence may be forming on the MACD. While the MACD is negative, the signal line is starting to curve upward. This suggests that the selling pressure is exhausting.
If Bitcoin can hold the $85,000 level, we may see a relief rally toward the $88,000 – $90,000 zone. A break below $85,000 would be highly bearish.
BTCUSD 1H Chart
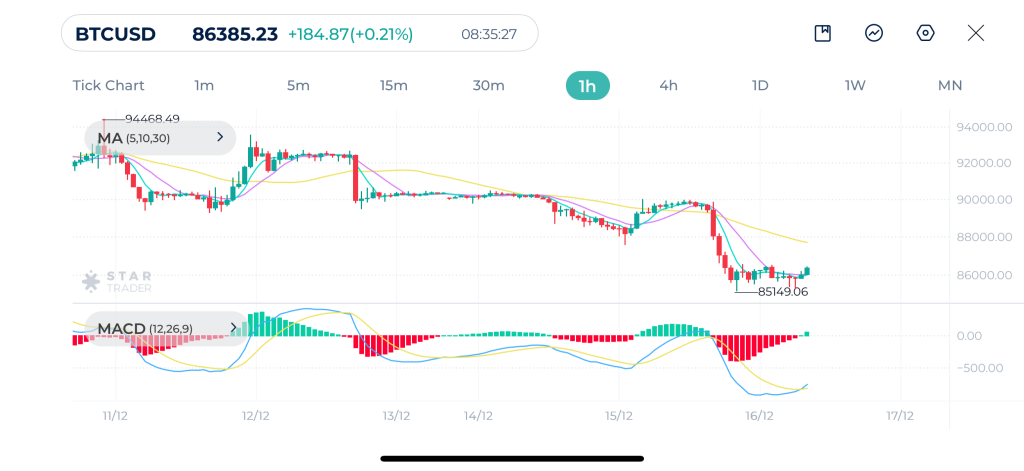
| Resistance | $87,045 | $87,756 | $88,185 |
| Support | $85,645 | $85,215 | $84,642 |
GBPUSD Technical Analysis
After hitting a peak of around 1.3437 on Thursday, GBPUSD has entered a period of lower highs. It is currently oscillating in a tight range. The price is currently trading below the 30-period moving average, which is acting as dynamic resistance.
MACD is hovering near the zero line and the signal line is flat, confirming a consolidation phase.
A break below the recent support at 1.3320 could trigger a deeper sell-off. Conversely, a sustained move back above 1.3380 is needed to regain bullish momentum.
GBPUSD 1H Chart
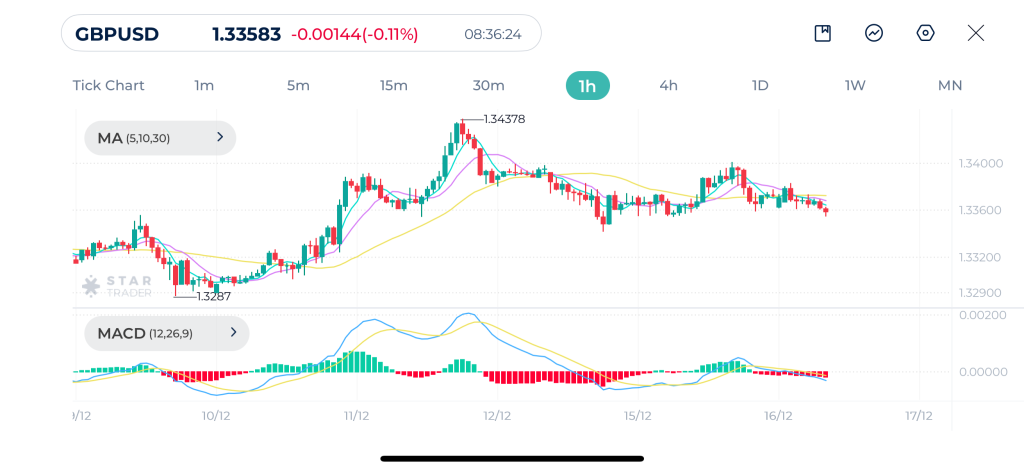
| Resistance | 1.3383 | 1.3400 | 1.3413 |
| Support | 1.3355 | 1.3339 | 1.3327 |
Nasdaq Technical Analysis
Nasdaq saw a significant rejection from the 25,879 level last Thursday. The chart shows a series of aggressive red candles on the 4H chart, indicating strong selling pressure.
There is a clear bearish crossover with shorter-term moving averages crossing below the 30-period moving average. MACD is deeply in negative territory. And the MACD line is accelerating away from the signal line, indicating that downward momentum is increasing.
The index looks oversold in the short term, but there are no signs of a reversal yet. Watch for a potential bounce or consolidation around 24,700 psychological support.
Nasdaq 4H Chart
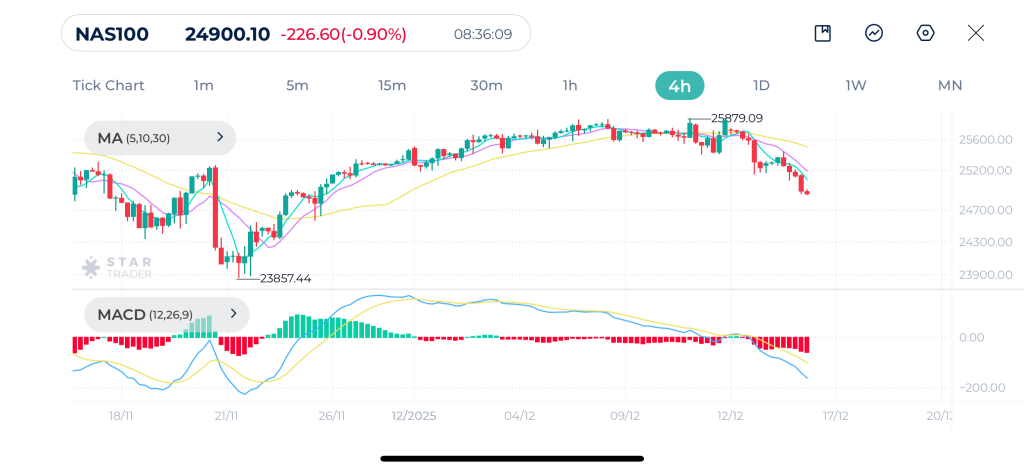
| Resistance | 25,018 | 25,153 | 25,391 |
| Support | 24,751 | 24,650 | 24,532 |
Tags
Open Live Account
Please enter a valid country
No results found
No results found
Please enter a valid email
Please enter a valid verification code
1. 8-16 characters + numbers (0-9) 2. blend of letters (A-Z, a-z) 3. special characters (e.g, !a#S%^&)
Please enter the correct format
Please tick the checkbox to proceed
Please tick the checkbox to proceed
Important Notice
STARTRADER does not accept any applications from Australian residents.
To comply with regulatory requirements, clicking the button will redirect you to the STARTRADER website operated by STARTRADER PRIME GLOBAL PTY LTD (ABN 65 156 005 668), an authorized Australian Financial Services Licence holder (AFSL no. 421210) regulated by the Australian Securities and Investments Commission.
CONTINUEImportant Notice for Residents of the United Arab Emirates
In alignment with local regulatory requirements, individuals residing in the United Arab Emirates are requested to proceed via our dedicated regional platform at startrader.ae, which is operated by STARTRADER Global Financial Consultation & Financial Analysis L.L.C.. This entity is licensed by the UAE Capital Market Authority (CMA) under License No. 20200000241, and is authorised to introduce financial services and promote financial products in the UAE.
Please click the "Continue" button below to be redirected.
CONTINUEError! Please try again.

