








 Web Trader MT5











AUDUSD Technical Analysis
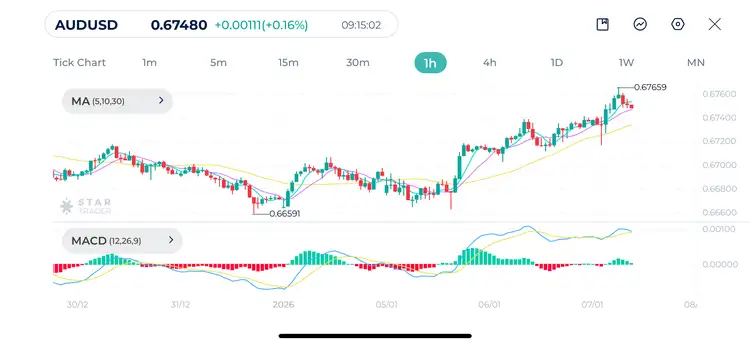
AUDUSD is in a steady uptrend on the 1H chart but is currently experiencing a healthy technical pullback.
The structure is bullish as it shows higher highs and higher lows. Price is currently testing the short term moving average MA(10) as support. As long as it stays above the longer term moving average MA(30), the uptrend remains intact.
MACD remains above the zero line, but we see a bearish crossover of the signal lines and the first few red bars. This suggests a shor -term correction or consolidation period is underway before the next leg up.
If the 0.6740 support holds, the pair is likely to retest 0.6765. If it fails, look for a deeper retracement toward the 0.6725 zone.
AUDUSD 1H Chart
| Resistance | 0.6766 | 0.6705 | 0.6746 |
| Support | 0.6736 | 0.6711 | 0.6694 |
Brent Technical Analysis
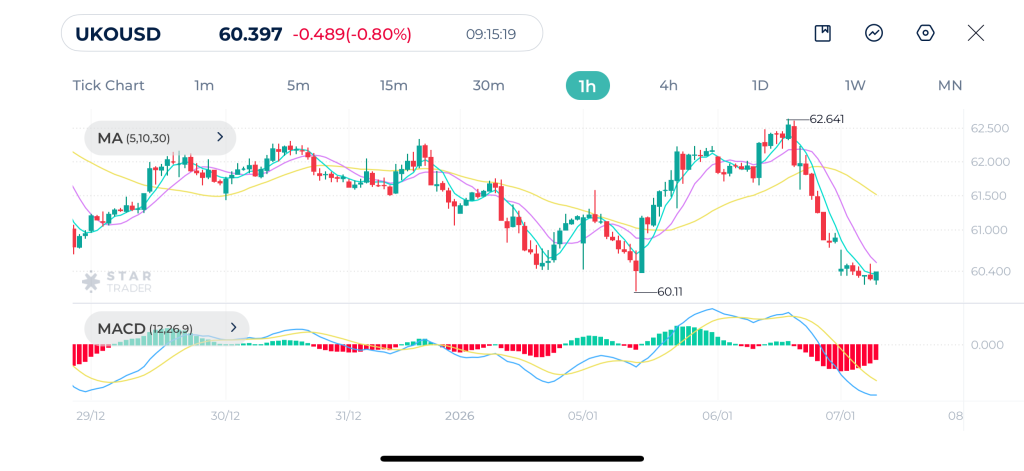
The hourly chart of Brent displays a bearish reversal following a failed attempt to hold highs above $62.50 earlier in the week.
Price has broken several support levels and is currently trading at $60.39, very close to the recent swing low of $60.11.
All three moving averages MA(5), MA(10), and MA(30) are sloping downward and price is trading below all of them. MACD is firmly in bearish territory and confirming strong downward momentum.
The critical level to watch is $60.11. A clean break below this support could trigger a drop toward the $59.00 level. Conversely, any bounce will likely face strong resistance at $61.20, where the moving averages are currently converging.
Brent 1H Chart
| Resistance | $60.28 | $60.70 | $61.12 |
| Support | $59.71 | $59.14 | $58.88 |
Dow Jones Technical Analysis
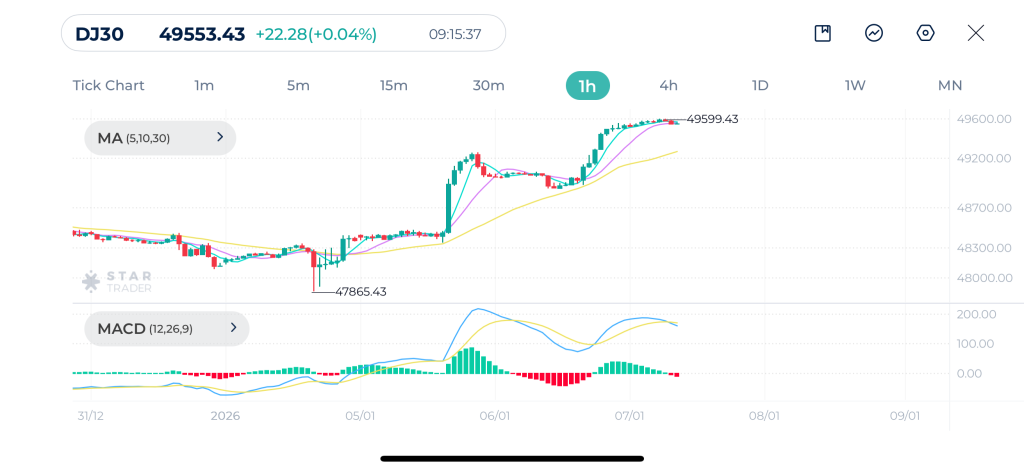
Dow Jones shows a strong bullish trend on the hourly chart, which is in line with the long term trend. The index broke to new record highs in yesterday’s session surpassing 49,500 and it is currently hovering just below that all-time high.
Price remains above the longer moving average MA(30), which acted as dynamic support during the initial rally.
MACD is still positive but shows bearish divergence. While price made a higher high, the MACD peaks are getting lower. This indicates that the buying pressure is exhausting.
A break above 49,600 could lead to extending the rally. However, if price falls below MA(5) with closure, we may see a move back toward the 49,200 level.
Dow Jones 1H Chart
| Resistance | 49,553 | 49,600 | 49,700 |
| Support | 49,450 | 49,187 | 49,000 |
Tags


Open Live Account
 Email Address
 Phone Number
Important Notice
STARTRADER does not accept any applications from Australian residents.
To comply with regulatory requirements, clicking the button will redirect you to the STARTRADER website operated by STARTRADER PRIME GLOBAL PTY LTD (ABN 65 156 005 668), an authorized Australian Financial Services Licence holder (AFSL no. 421210) regulated by the Australian Securities and Investments Commission.
Important Notice for Residents of the United Arab Emirates
In alignment with local regulatory requirements, individuals residing in the United Arab Emirates are requested to proceed via our dedicated regional platform at startrader.ae, which is operated by STARTRADER Global Financial Consultation & Financial Analysis L.L.C.. This entity is licensed by the UAE Capital Market Authority (CMA) under License No. 20200000241, and is authorised to introduce financial services and promote financial products in the UAE.
Please click the "Continue" button below to be redirected.


