


U.S. Dollar Index (USDX)
The dollar was down on Friday morning in Asia after the European Central Bank raised interest rates more than expected on Thursday as concerns about runaway inflation trumped worries about growth.
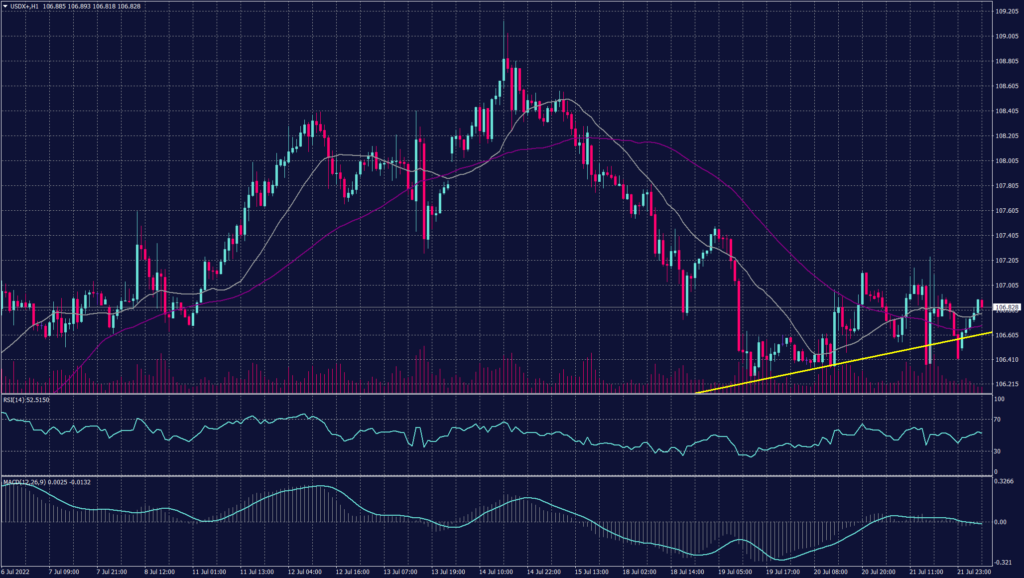
The U.S. dollar Index that tracks the greenback against a basket of other currencies inched down 0.01% to 106.91.
The dollar was weighed down overnight by a decline in Treasury yields after data showed a slump in factory activity and a rise in applications for unemployment benefits. This signals that the economy is already feeling the effects of aggressive U.S. Federal Reserve policy tightening.
On the hourly chart, technical indicators show a possibility of continuation of the downtrend as RSI is heading to 30 and MACD shows a possible decline.
PIVOT POINT: 106.75
| SUPPORT | RESISTANCE |
| 106.50 | 106.85 |
| 106.40 | 107.40 |
| 106.20 | 107.70 |
Euro (EURUSD)
The euro headed for its best week since May on Friday after the European Central Bank (ECB) raised borrowing costs more than expected overnight in its first rate hike since 2011. The European Central Bank hiked interest rates by 50 basis points on Thursday to contain soaring inflation.
However, the single currency was well off Thursday’s knee-jerk peak after ECB President Christine Lagarde said that while the monetary authority was moving faster than previously signalled.
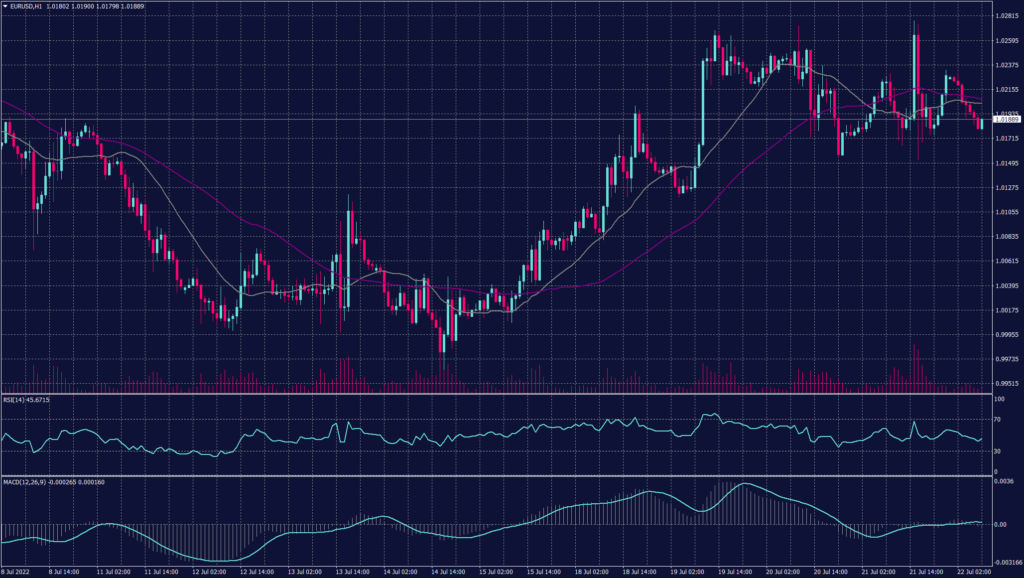
The single currency eased 0.2% on Friday to $1.0205, giving back a little of the previous session’s 0.5% advance, but remained on course for a 1.21% weekly rally.
Meanwhile, the hourly chart reflects a corrective movement in a long secondary trend targeting 1.0550 as the next resistance. However, the daily chart remains to hold the negative trend aiming towards 0.9960.
PIVOT POINT: 1.0200
| SUPPORT | RESISTANCE |
| 1.0100 | 1.0270 |
| 0.9960 | 1.0350 |
| 0.9850 | 1.0470 |
Spot Gold (XAUUSD)
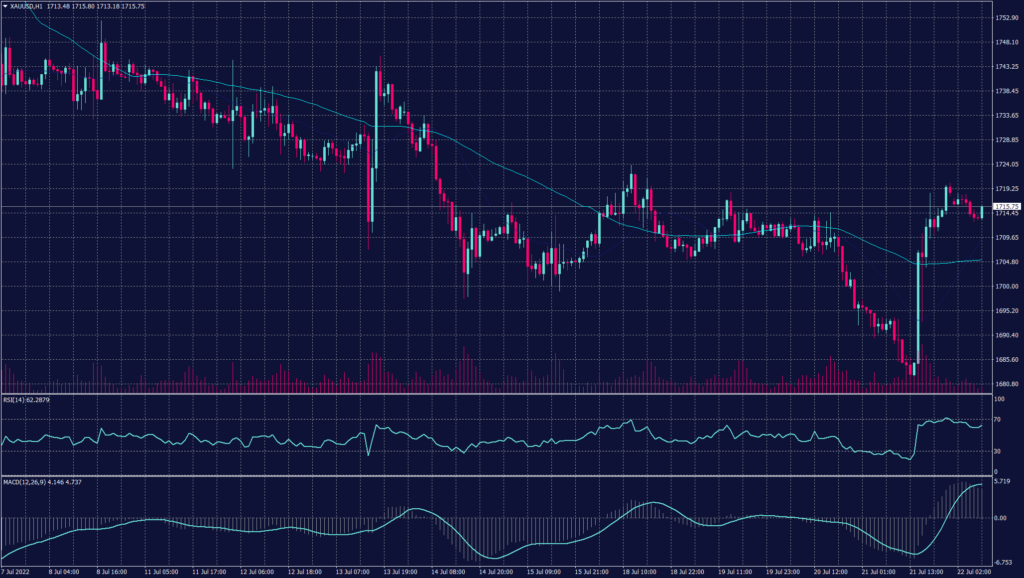
The precious metal jumped $12 yesterday closing at $1,718 an ounce but traded red during the early trades as investors are concerned about interest rate hikes by major central banks to curb inflation. The U.S. Federal Reserve is widely expected to raise interest rates by 75-100 basis points at its July 26-27 policy meeting.
The U.S. economy is slowing as data on Thursday showed the U.S. weekly initial jobless claims rose to a fresh eight-month high and factory activity for July slumped. In other precious metals, spot silver fell 0.3%, platinum gained 0.3%, and palladium rose 0.2%.
Gold chart formed an ingulfing candle yesterday which covers the day before, however, todays close will confirm or abort the assumption of the ingulfing candle. In the scenario of confirming the reversal pattern, gold prices are expected to end this week around $1,724 and continue trading between $1,720 and $1,740 per ounce. On the other hand, if the prices aborted the assumption, gold prices might decline below 1,680.
PIVOT POINT: 1,715
| SUPPORT | RESISTANCE |
| 1,700 | 1,720 |
| 1,680 | 1,733 |
| 1,675 | 1,740 |
West Texas Crude (USOUSD)
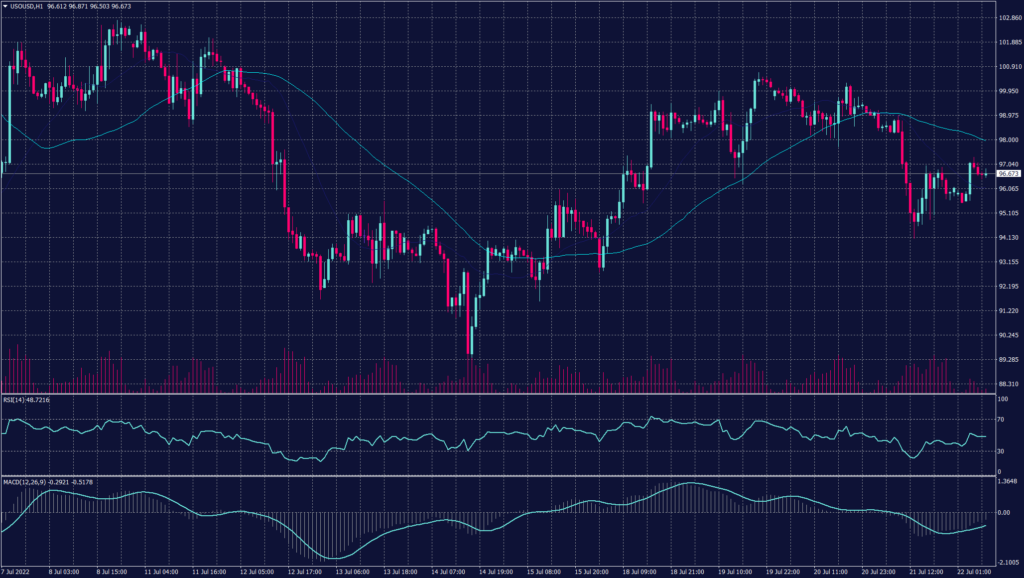
Oil prices rose during the Asian session, rebounding from previous declines on supply tightness and geopolitical tensions even though weakened demand in the United States has cast a shadow on the market this week. Brent crude futures rose 1.5% to $105.37 a barrel, while WTI crude futures gained 1.4% to $97.69 a barrel.
WTI has been pummelled over the past two sessions after data showed that U.S. gasoline demand had dropped nearly 8% from a year earlier amid the peak summer driving season, hit by record prices at the pump. In contrast, signs of strong demand in Asia propped up the Brent benchmark, putting it on course fo its first weekly gain in six weeks.
Crude oil is falling for the second day after as traders weigh the impact on demand from a potential recession, as well as a broad appetite for risk and wider market moves.
On the hourly chart, the prices show a tendency to decline as the resistance is strengthening below $99 a barrel. Meanwhile, technical indicators confirm a possibility of a drop towards $93.70 a barrel.
PIVOT POINT: 96.60
| SUPPORT | RESISTANCE |
| 96.00 | 99.00 |
| 94.00 | 101.00 |
| 92.20 | 102.10 |
Tags
Open Live Account
Please enter a valid country
No results found
No results found
Please enter a valid email
Please enter a valid verification code
1. 8-16 characters + numbers (0-9) 2. blend of letters (A-Z, a-z) 3. special characters (e.g, !a#S%^&)
Please enter the correct format
Please tick the checkbox to proceed
Please tick the checkbox to proceed
Important Notice
STARTRADER does not accept any applications from Australian residents.
To comply with regulatory requirements, clicking the button will redirect you to the STARTRADER website operated by STARTRADER PRIME GLOBAL PTY LTD (ABN 65 156 005 668), an authorized Australian Financial Services Licence holder (AFSL no. 421210) regulated by the Australian Securities and Investments Commission.
CONTINUEImportant Notice for Residents of the United Arab Emirates
In alignment with local regulatory requirements, individuals residing in the United Arab Emirates are requested to proceed via our dedicated regional platform at startrader.ae, which is operated by STARTRADER Global Financial Consultation & Financial Analysis L.L.C.. This entity is licensed by the UAE Capital Market Authority (CMA) under License No. 20200000241, and is authorised to introduce financial services and promote financial products in the UAE.
Please click the "Continue" button below to be redirected.
CONTINUEError! Please try again.

