


U.S. Dollar Index (USDX)
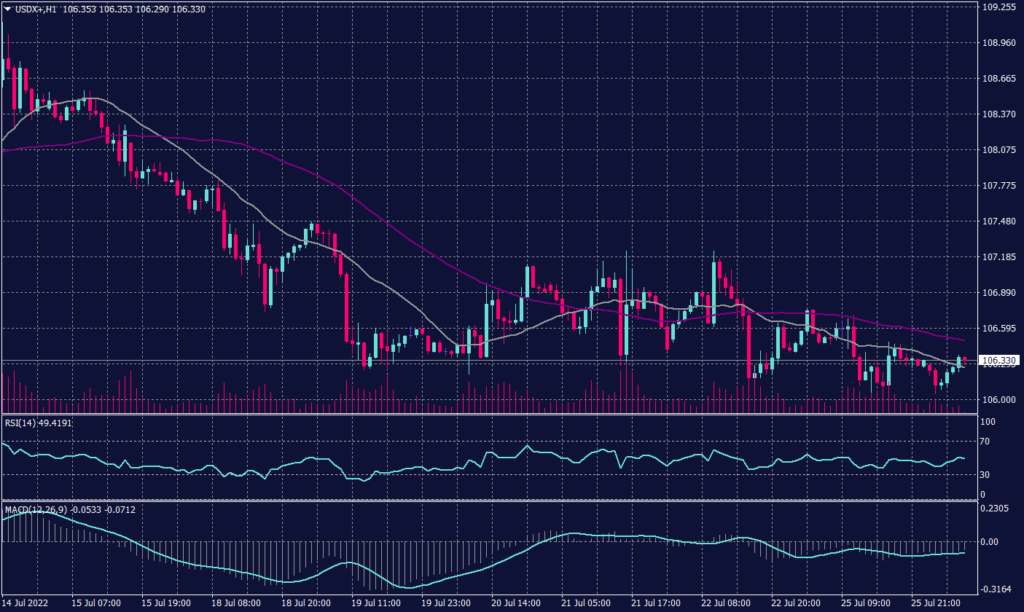
The dollar held just below multi-decade peaks on Tuesday as traders awaited a rate hike from the U.S. Federal Reserve. Meanwhile, traders also wondered whether hints of a slowing economy might prompt a shift away from Fed’s focus on inflation. The Fed ends its two-day meeting tomorrow while traders have been dialing back expectations about the rate hike.
The U.S. dollar index traded slightly lower at 106.270 during the early sessions as expectations of the U.S. rate increase provided support. The U.S. Dollar index remained positive in all time frames, although it slightly slipped this morning. On the hourly chart, the index is hovering in a horizontal fashion building momentum above the support at 106.20.
Meanwhile, on the daily chart, the trendline shows a text-book pattern of an upward continuation. However, Technical indicators signal a slight retreat on the hourly and daily chart during the day before the continuation of the uptrend.
PIVOT POINT: 106.60
| SUPPORT | RESISTANCE |
| 106.50 | 106.85 |
| 106.40 | 107.40 |
| 106.20 | 107.70 |
Euro (EURUSD)
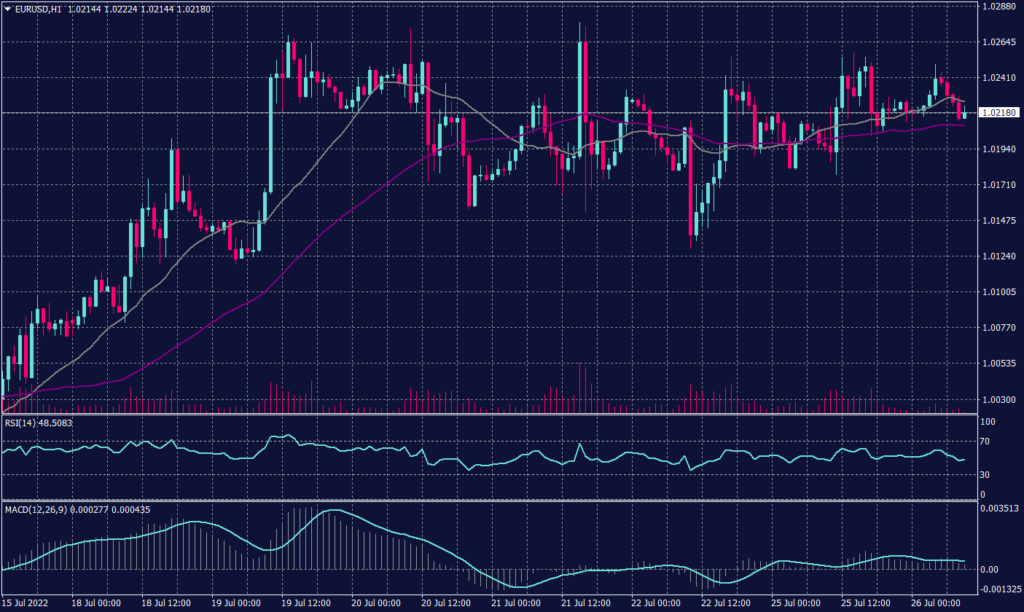
The Common currency found some peace before the Fed meeting as the U.S. dollar slowed. The major pair hit the resistance at 1.02250 and traded below it for the past six days while inflationary tension rise.
Meanwhile, technical indicators show mixed signals as MACD shows a possibility of breaking above the current resistance. However, RSI is moving at neutral levels while the moving averages indicate a tendency to decline.
PIVOT POINT: 1.0200
| SUPPORT | RESISTANCE |
| 1.0100 | 1.0270 |
| 0.9960 | 1.0350 |
| 0.9850 | 1.0470 |
Spot Gold (XAUUSD)
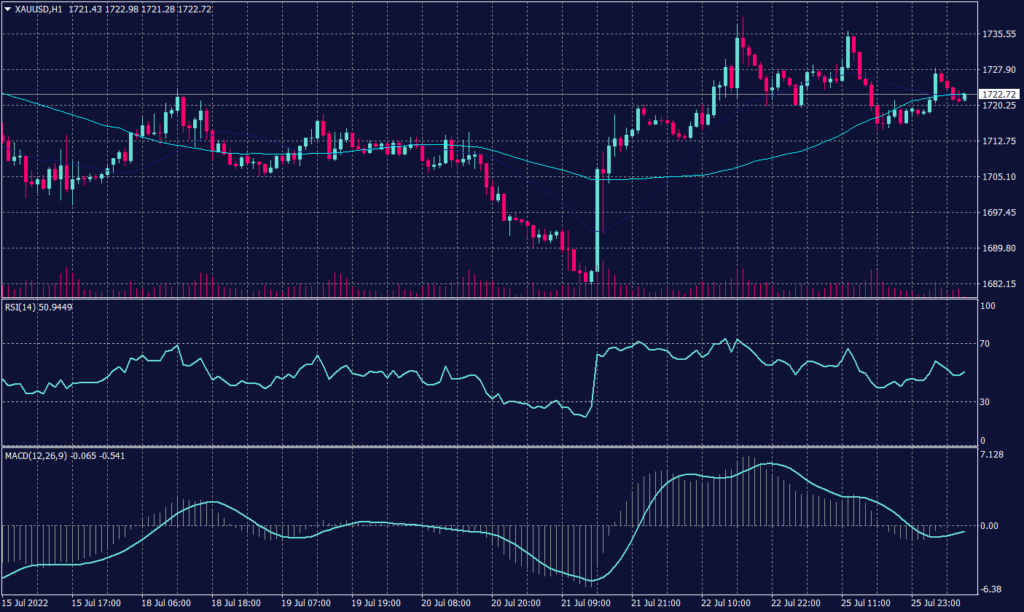
Gold was up 0.27% to $1,723.75 this morning in Asia over a weaker dollar, but prices were stuck in a tight range as investors shifted focus to a possible U.S. interest rate hike.
The Fed concludes its two-day meeting on Wednesday, where it is widely expected to raise interest rates by 75 basis points. However, a hike of 100 basis points is floating on the horizon.
The daily gold chart shows a tendency for a decline, but it also shows support above $1,715. Meanwhile, the hourly chart shows smaller candles and a shorter range which indicates a possibility of an impulsive downwards movement. Technical indicators also confirm the possibility of the decline.
PIVOT POINT: 1,720
| SUPPORT | RESISTANCE |
| 1,715 | 1,726 |
| 1,710 | 1,733 |
| 1,700 | 1,740 |
West Texas Crude (USOUSD)
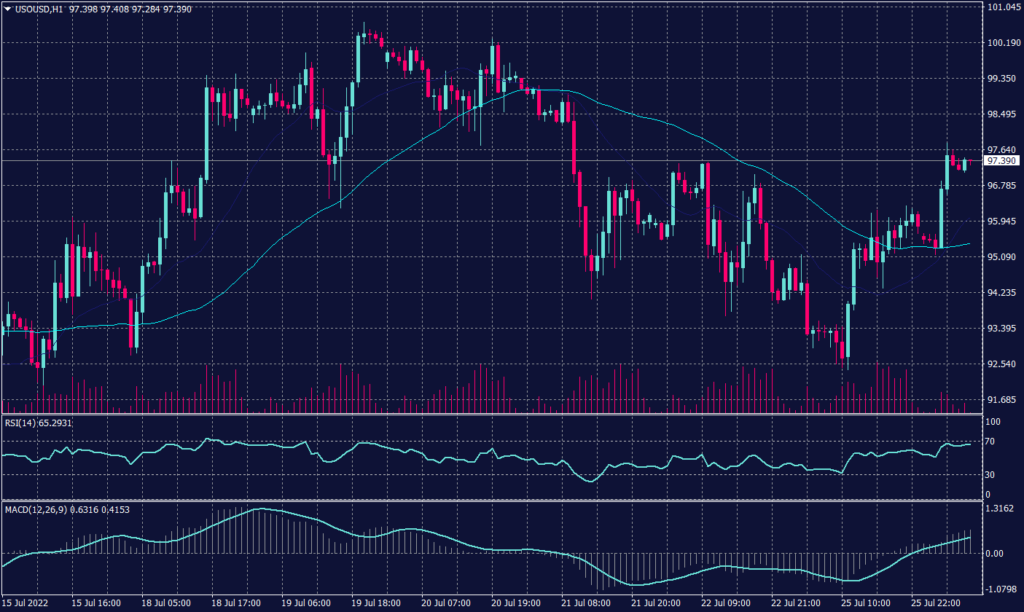
Crude oil traded up on Tuesday morning in Asia on expectations that Russia’s reduction in natural gas supply to Europe could encourage a switch to crude. But concerns over weakening fuel demand on an expected U.S. interest rate hike capped the gains. Both benchmarks gained around 1.4% today as Brent rose to $101.63 while WTI crude traded at $98.05.
WTI daily chart remains negative while technical indicators are indecisive. Moving averages for 20 and 55 days support the assumption of further decline. Meanwhile, the hourly chart shows an uptrend targeting $98.80 per barrel while technical indicators are opposing. RSI signals a near downturn while the MACD flattens.
PIVOT POINT: 97.60
| SUPPORT | RESISTANCE |
| 96.00 | 98.80 |
| 95.50 | 99.40 |
| 95.00 | 99.80 |
Tags
Open Live Account
Please enter a valid country
No results found
No results found
Please enter a valid email
Please enter a valid verification code
1. 8-16 characters + numbers (0-9) 2. blend of letters (A-Z, a-z) 3. special characters (e.g, !a#S%^&)
Please enter the correct format
Please tick the checkbox to proceed
Please tick the checkbox to proceed
Important Notice
STARTRADER does not accept any applications from Australian residents.
To comply with regulatory requirements, clicking the button will redirect you to the STARTRADER website operated by STARTRADER PRIME GLOBAL PTY LTD (ABN 65 156 005 668), an authorized Australian Financial Services Licence holder (AFSL no. 421210) regulated by the Australian Securities and Investments Commission.
CONTINUEImportant Notice for Residents of the United Arab Emirates
In alignment with local regulatory requirements, individuals residing in the United Arab Emirates are requested to proceed via our dedicated regional platform at startrader.ae, which is operated by STARTRADER Global Financial Consultation & Financial Analysis L.L.C.. This entity is licensed by the UAE Capital Market Authority (CMA) under License No. 20200000241, and is authorised to introduce financial services and promote financial products in the UAE.
Please click the "Continue" button below to be redirected.
CONTINUEError! Please try again.

