


market news summary
Market risk appetite improved after the minutes from the U.S. Federal Reserve’s last meeting confirmed the potential for a pause in rate hikes after two more half-point increases in June and July 2022.
Fed minutes were below expectations;
Fed might pause rate hikes;
Gold reaction was disappointing;
Crude oil remains on the uptrend.
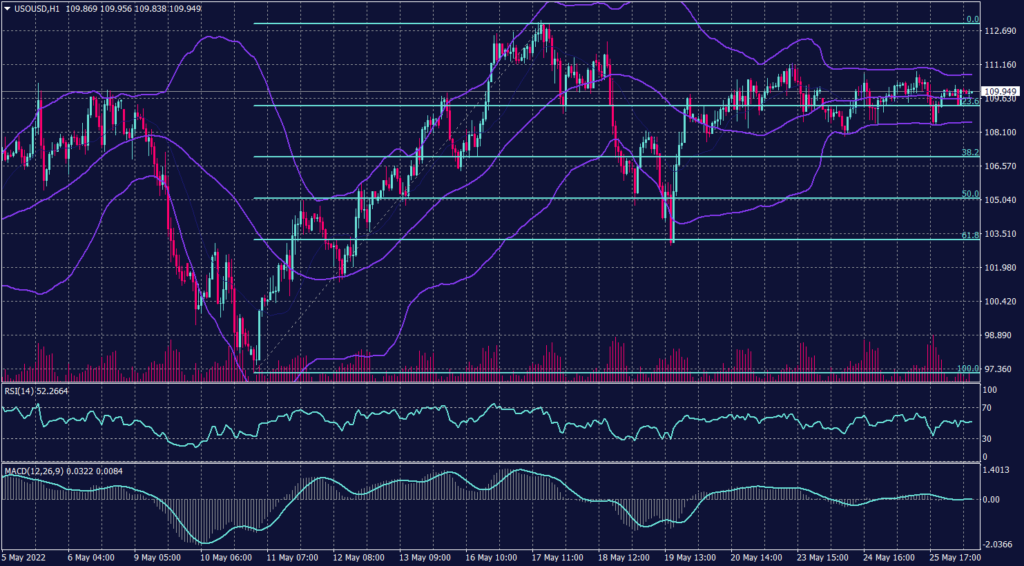
U.S. Dollar Index (USDX)
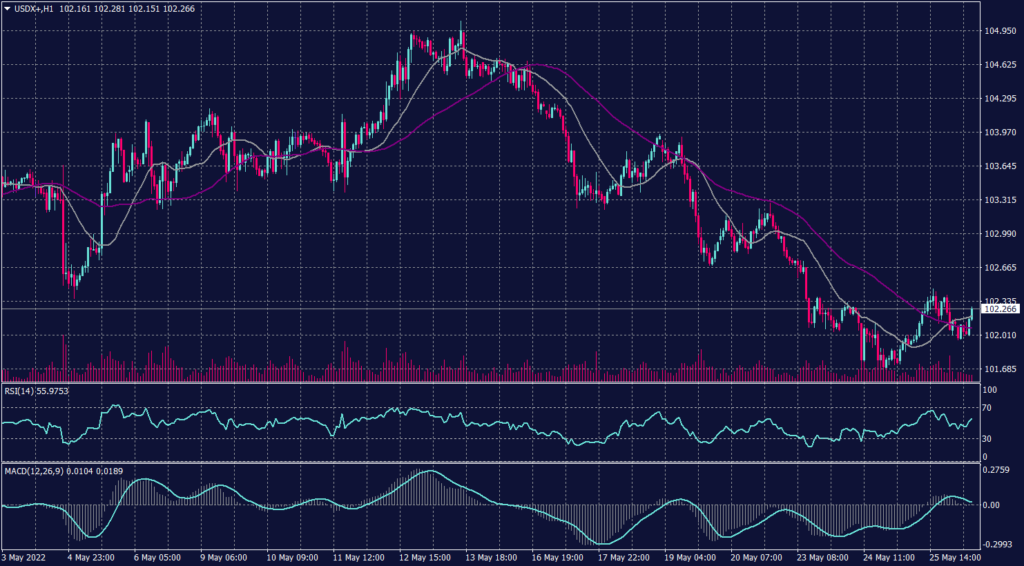
The dollar index settled around 102.03 after Fed minutes yesterday to rebound a little afterward. However, the dollar slowed during the early Asian session. Additionally, Atlanta Federal Reserve President Raphael Bostic had already suggested earlier in the week that a pause might be the best course of action in September 2022 to monitor the effects on the economy following two more 50-basis-point hikes in June and July.
Technically:
The U.S. Dollar Index inched down 0.06% to 101.83 hovering near the lowest rate in a month. Additionally, the index still trading below the 20 day and 55 day moving average on the daily chart and hourly chart indicating a possibility for a further decline.
Likewise, the index is cementing its declining pattern on the hourly chart which targets 101.20 on the hourly chart. Technical indicators are not providing clear signals which indicate the need to hold until there is a clear direction.
PIVOT POINT: 102.20
| SUPPORT | RESISTANCE |
| 101.60 | 102.60 |
| 101.40 | 103.10 |
| 101.20 | 103.35 |
Euro (EURUSD)
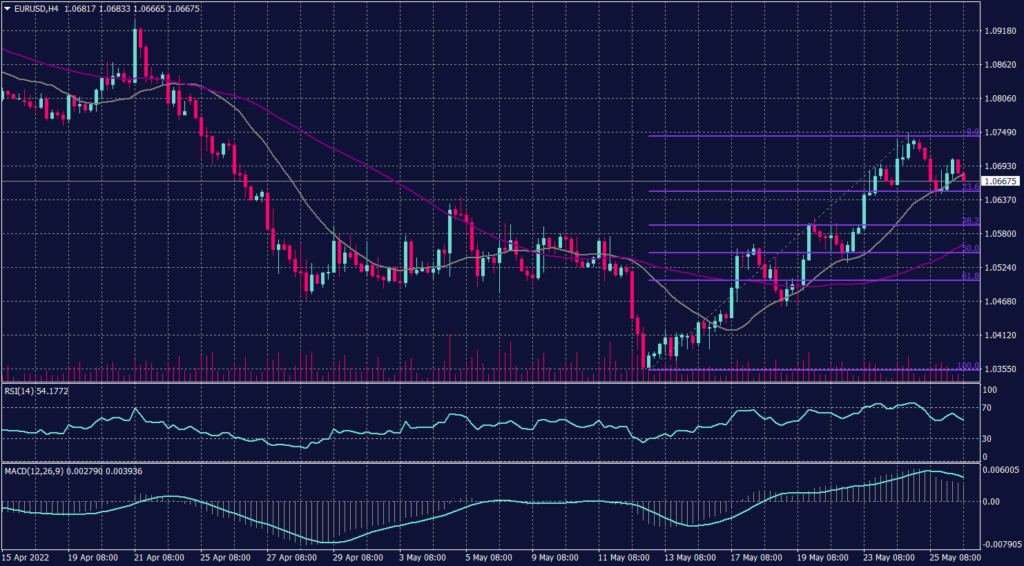
The minutes from the Fed’s May 3-4 meeting, showed that all policymakers supported the central bank’s rate increase of 50 basis points, the first of that size in more than 20 years. European stock markets traded lower yesterday after the Fed minutes. The DAX futures contract in Germany traded 0.3% lower, CAC 40 futures in France traded 0.1% lower, and the FTSE 100 futures contract in the U.K. fell 0.3%.
Technically:
The European currency fell after touching the resistance of 1.0750 and kept trading above the support of 1.0610 and is expected to move in a semi-horizontal trend. However, Fibonacci retracement shows a solid resistance around 1.0610 and the possibility of a retreat towards 1.0560. Technical indicators show a higher possibility to fall than continuing the uptrend, however, the moving average on the daily chart remains below the current price levels.
PIVOT POINT: 1.0710
| SUPPORT | RESISTANCE |
| 1.0610 | 1.0740 |
| 1.0550 | 1.0840 |
| 1.0510 | 1.0910 |
Sterling Pounds (GBPUSD)
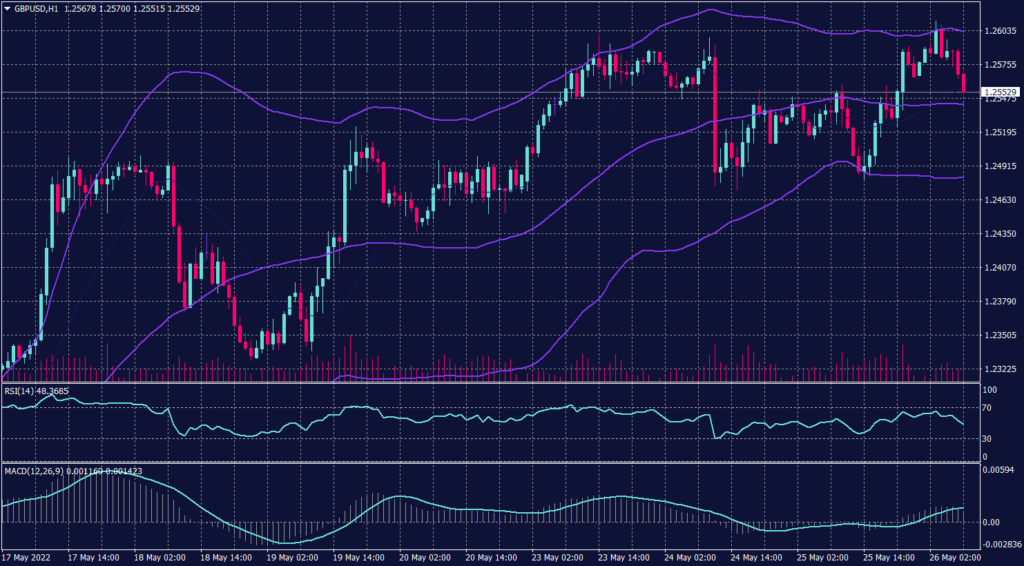
The Cable remains under pressure around the resistance level of 1.2550 on both the daily and hourly charts. However, the sterling pound remains inside the declining channel on the daily time frame.
The price chart is touching the upper band of Bollinger Bands indicators, which signals a higher possibility to retreat towards 1.2560 on the hourly chart and 1.2460 on the daily chart.
Meanwhile, the pair shows a possibility to move on the hourly time frame between 1.2440 and 1.2500. The RSI and MACD are showing signals for a further decline, while price action retains the reading of 1.2100 on the daily time frame.
PIVOT POINT: 1.2565
| SUPPORT | RESISTANCE |
| 1.2500 | 1.2622 |
| 1.2440 | 1.2695 |
| 1.2350 | 1.2750 |
Japanese Yen (USDJPY)
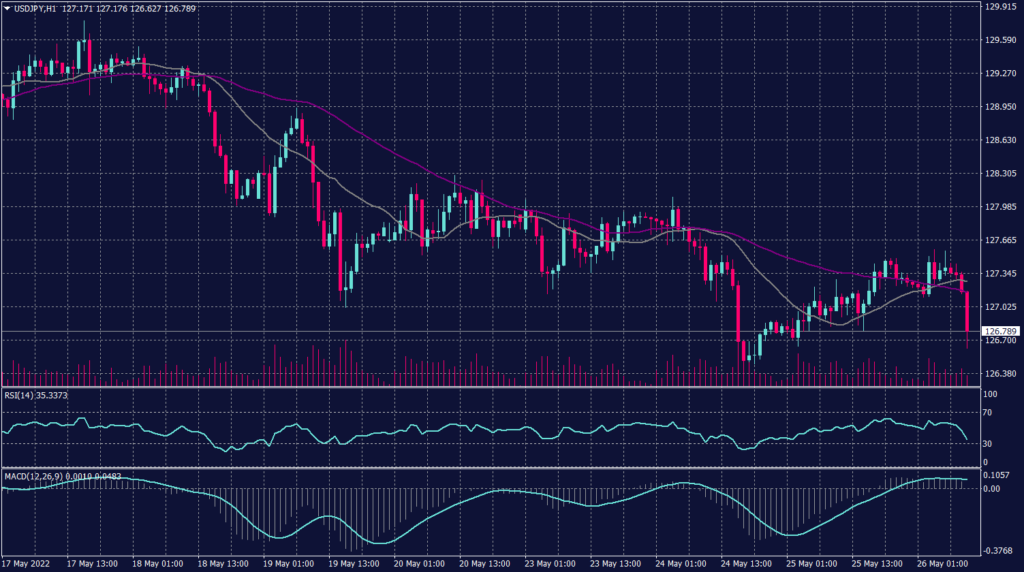
The Japanese Yen retains its momentum against the greenback and cements its trend after touching its best rate in a month below 127.00. The USDJPY pair has fallen in the early European session to 126.60.
Meanwhile, the pair is confirming the downtrend on the hourly chart and signalling a higher possibility of the continuation on the daily chart. While the moving average reading indicates that the current level is critical resistance, MACD and RSI readings remain neutral.
PIVOT POINT: 126.60
| SUPPORT | RESISTANCE |
| 126.30 | 127.40 |
| 125.90 | 128.00 |
| 125.60 | 128.40 |
Spot Gold (XAUUSD)
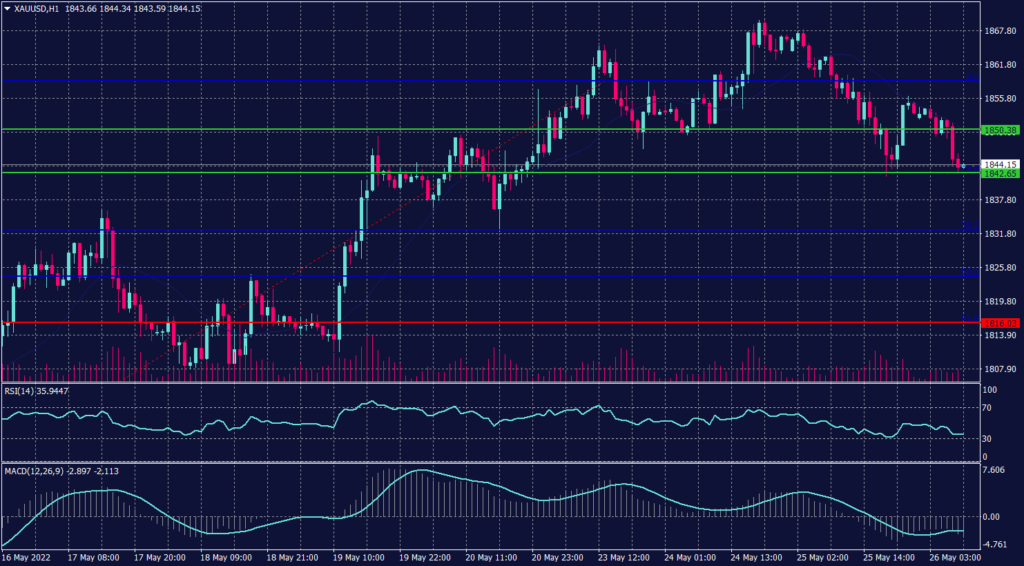
Gold was up on Thursday morning in Asia, while U.S. Treasury yields gained. The Federal Reserve’s minutes from its last meeting also showed the central bank was unlikely to be more aggressive on interest rate hikes. Gold futures edged up 0.14% to $1,848.96. Gold cut some dollar strength-driven losses after Wednesday’s Fed minutes suggested the central bank would raise interest rates by 50 basis points in June and July 2022 to prevent inflation, which has become a key threat to the economy’s performance.
Technically:
Gold prices dipped slightly during the early trades reaching near a week low. However, spot gold remains hovering near the support at $1,850 per ounce unless it broke below 1,842.
However, gold reaction to Fed minutes might be delayed as price action shows a possibility of a further drop, while RSI and MACD signal possible gains.
PIVOT POINT: 1,842
| SUPPORT | RESISTANCE |
| 1,810 | 1,875 |
| 1,800 | 1,895 |
| 1,792 | 1,905 |
West Texas Crude (USOUSD)
Brent oil futures were up 0.31% to $111.47 and WTI futures for July delivery rose 0.50% to $110.80. Market participants also received crude oil supply data from the U.S. Energy Information Administration (EIA). The data showed a decline of 1.019 million barrels in the week to May 20, 2022. Meanwhile, crude oil supply data from the American Petroleum Institute released the day before, showed a build of 567,000 barrels.
Technically:
WTI remains to hover in a horizontal fashion near $110 in the short-term as worries about supply grow, but it remains in the uptrend channel on the daily chart. Meanwhile, on the hourly chart, WTI has formed support above $109 to weaken the resistance at $111.30.
Despite the heavy buying momentum, technical indicators show a possibility to see crude oil hovering around $109. However, Fibonacci retracement and 20 periods moving average show a higher probability of continuing climbing.
PIVOT POINT: 109.70
| SUPPORT | RESISTANCE |
| 107.10 | 111.30 |
| 105.75 | 112.75 |
| 104.30 | 115.00 |
Tags
Open Live Account
Please enter a valid country
No results found
No results found
Please enter a valid email
Please enter a valid verification code
1. 8-16 characters + numbers (0-9) 2. blend of letters (A-Z, a-z) 3. special characters (e.g, !a#S%^&)
Please enter the correct format
Please tick the checkbox to proceed
Please tick the checkbox to proceed
Important Notice
STARTRADER does not accept any applications from Australian residents.
To comply with regulatory requirements, clicking the button will redirect you to the STARTRADER website operated by STARTRADER PRIME GLOBAL PTY LTD (ABN 65 156 005 668), an authorized Australian Financial Services Licence holder (AFSL no. 421210) regulated by the Australian Securities and Investments Commission.
CONTINUEImportant Notice for Residents of the United Arab Emirates
In alignment with local regulatory requirements, individuals residing in the United Arab Emirates are requested to proceed via our dedicated regional platform at startrader.ae, which is operated by STARTRADER Global Financial Consultation & Financial Analysis L.L.C.. This entity is licensed by the UAE Capital Market Authority (CMA) under License No. 20200000241, and is authorised to introduce financial services and promote financial products in the UAE.
Please click the "Continue" button below to be redirected.
CONTINUEError! Please try again.

