


market news summary
Fed hiked 75 bp and recession is on the horizon;
BOE is expected to hike 50 pb today;
Gold loses havens battle;
Crude oil remains bearish;
China demand expectations support crude prices.
U.S. Dollar Index (USDX)
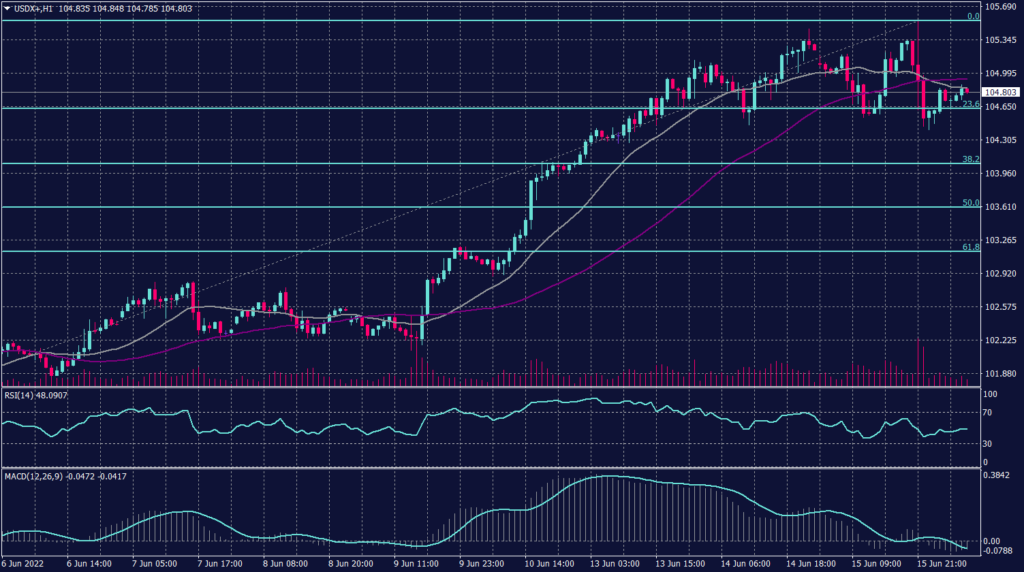
The Fed’s decision drove longer-dated U.S. government bond yields lower and nudged the dollar 0.15% off two-decade highs to 104.78. The U.S. Federal Reserve raised interest rates by 75 basis points to tame inflation after the U.S. consumer price index rose 8.6% in May, the largest since 1994.
The Fed Chair Jerome Powell said the central bank will deliver another big hike in July, but “today’s 75 basis-point increase is an unusually large one and I do not expect moves of this size to be common.”
Technically:
The U.S. Dollar Index lost 0.15% amid the Fed decision on the 75 pb increase. However, the technical reading show this decline as a short term corrective movement. Additionally, Fibonacci retracement show 104.60 as support level, while 20 and 55 periods moving averages signal upward movement towards 105.30. Meanwhile, the daily chart shows a continuation to the uptrend and targets 105.60.
PIVOT POINT: 105.10
| SUPPORT | RESISTANCE |
| 104.60 | 105.30 |
| 103.50 | 105.60 |
| 102.60 | 105.80 |
Sterling Pound (GBPUSD)
Market participants expect the Bank of England to deliver the fifth straight rate hike later today. In more details, market experts are betting the BOE will increase the key rate a quarter point to a 13-year high of 1.25% on Thursday.
The BOE started tightening monetary policy earlier than its peers, giving it room to move cautiously. Officials led by Governor Andrew Bailey are focused on how to curb inflation, which at 9% is forecast to hit double digits later this year, perhaps more than five times the 2% target.
The BOE’s the decision will be accompanied by minutes of the meeting, and Bailey isn’t scheduled to deliver a press conference.
Technically:
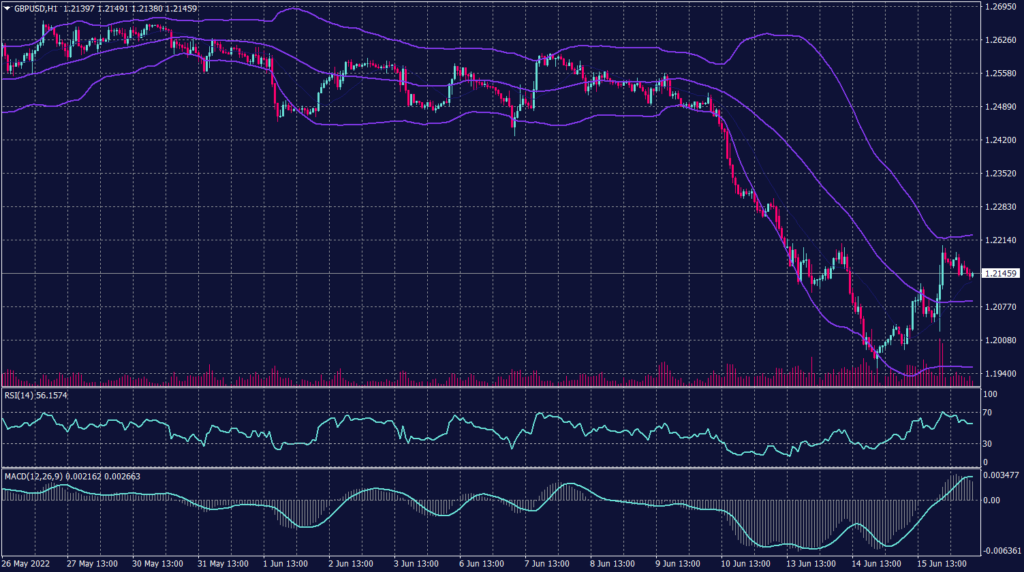
Sterling pound showed a corrective movement this morning against the weaker greenback deleting the losses recorded in the past two sessions. However, the cable remains in the downward channel and is set to trade below the 55 periods average on the hourly chart.
On the daily chart, the pair remains weakening and targets its lowest level since March 2020 between 1.1446 and 1.1410. The cable can not find shelter in the upcoming BOE statement unless it massively exceeded market expectations.
PIVOT POINT:1.2100
| SUPPORT | RESISTANCE |
| 1.1950 | 1.2150 |
| 1.1820 | 1.2200 |
| 1.1700 | 1.2280 |
Japanese Yen (USDJPY)
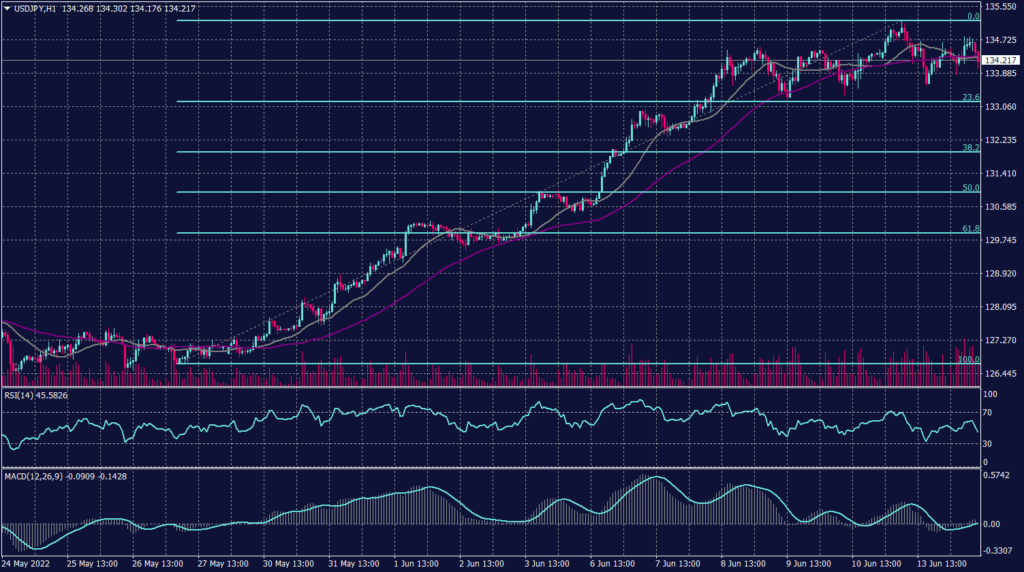
The samurai currency held ground against the greenback this morning retaining the horizontal movement between 133 and 135 on the hourly chart. The USDJPY pair retains the uptrend momentum on the daily chart under the condition of holding above 133.30 for the next couple of sessions.
RSI and MACD show unclear readings on the hourly chart and indicate a horizontal movement, while the daily chart readings are about a change in the direction. However, moving averages are showing a continuation on the daily chart.
PIVOT POINT: 134.60
| SUPPORT | RESISTANCE |
| 134.30 | 135.00 |
| 133.90 | 135.20 |
| 133.30 | 135.30 |
Spot Gold (XAUUSD)
Gold traded up as investors absorb the Fed’s decision to have a supersized interest rate hike but overall gold seems to lose havens battle. The U.S. Federal Reserve raised interest rates by 75 basis points Wednesday to tame inflation after the U.S. consumer price index rose 8.6%, the largest since 1994.
The Fed Chair Jerome Powell said the central bank will deliver another big hike in July, but “today’s 75 basis-point increase is an unusually large one and I do not expect moves of this size to be common.”
Technically:
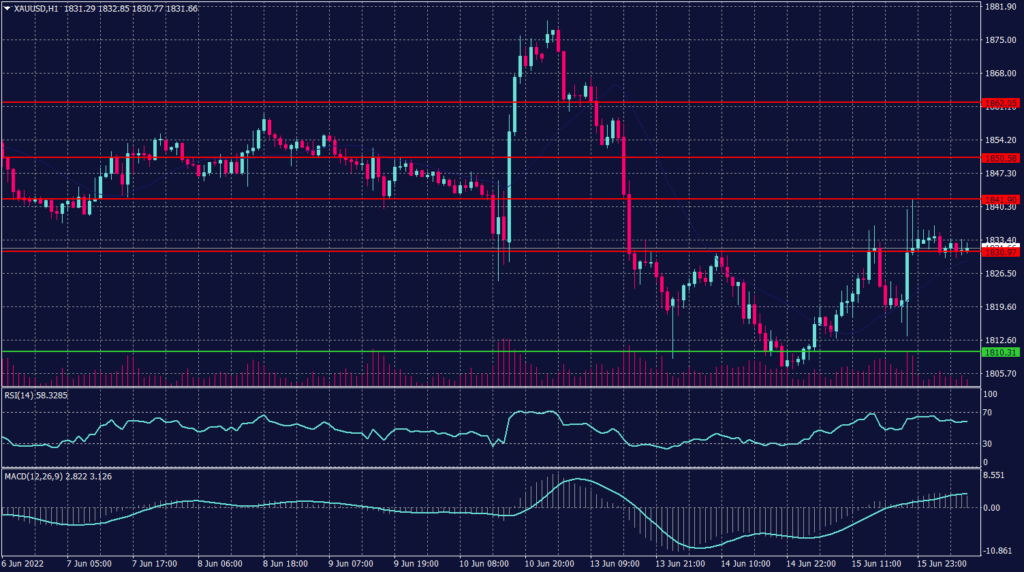
Gold was up 0.66% to 1,841 late yesterday, but it started to hover around 1,830 this morning indicating a possibility of continuing the negative trend. However, the daily chart retains the same horizontal readings between 1,810 and 1,870, which sets the gold for impulsive movements in either direction.
Technical indicators signal fluctuations within the previously mentioned rage with higher possibility of further decline towards 1,810.
PIVOT POINT: 1,830
| SUPPORT | RESISTANCE |
| 1,815 | 1,842 |
| 1,810 | 1,850 |
| 1,790 | 1,855 |
West Texas Crude (USOUSD)
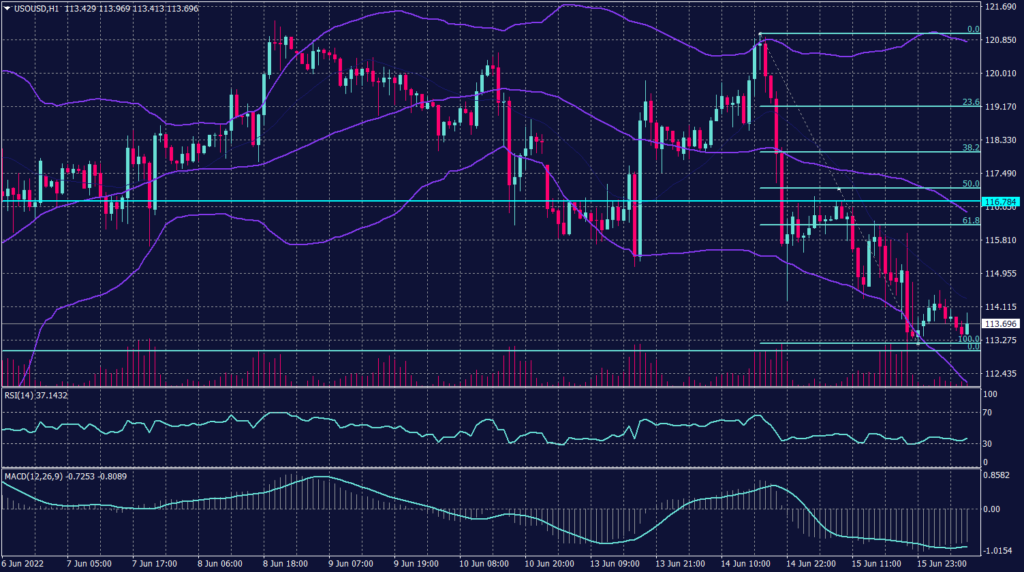
Oil prices recovered on Thursday from a steep drop in the previous session, supported by tight oil supply and peak summer consumption, after a U.S. rate hike sparked fears of slower economic growth and less fuel demand. Brent crude futures rebounded 0.9% to $119.61 a barrel, while U.S. West Texas Intermediate (WTI) crude futures rose to $116.59 a barrel.
Investors remained focused on tight supplies and strong demand as Western sanctions restricted access to Russian oil. Meanwhile, market participants expect China’s oil demand will rally as it eases COVID-19 restrictions. U.S. crude production edged up 100,000 barrels per day last week to 12 million bpd, its highest level since April 2020, data from the Energy Information Administration showed.
Technically:
WTI declined amid the supply report yesterday, but it found shelter in the Chinese demand expectations. However, the U.S. crude is expected to continue the decline towards $110 if it broke below $113.30 a barrel.
PIVOT POINT: 113.60
| SUPPORT | RESISTANCE |
| 112.00 | 116.00 |
| 110.00 | 118.00 |
| 119.40 | 119.60 |
Tags
Open Live Account
Please enter a valid country
No results found
No results found
Please enter a valid email
Please enter a valid verification code
1. 8-16 characters + numbers (0-9) 2. blend of letters (A-Z, a-z) 3. special characters (e.g, !a#S%^&)
Please enter the correct format
Please tick the checkbox to proceed
Please tick the checkbox to proceed
Important Notice
STARTRADER does not accept any applications from Australian residents.
To comply with regulatory requirements, clicking the button will redirect you to the STARTRADER website operated by STARTRADER PRIME GLOBAL PTY LTD (ABN 65 156 005 668), an authorized Australian Financial Services Licence holder (AFSL no. 421210) regulated by the Australian Securities and Investments Commission.
CONTINUEImportant Notice for Residents of the United Arab Emirates
In alignment with local regulatory requirements, individuals residing in the United Arab Emirates are requested to proceed via our dedicated regional platform at startrader.ae, which is operated by STARTRADER Global Financial Consultation & Financial Analysis L.L.C.. This entity is licensed by the UAE Capital Market Authority (CMA) under License No. 20200000241, and is authorised to introduce financial services and promote financial products in the UAE.
Please click the "Continue" button below to be redirected.
CONTINUEError! Please try again.

