


market news summary
USDX hits a resistance;
EURUSD signals a bounce;
Crude oil shed $3;
Gold is set to decline.
U.S. Dollar Index (USDX)
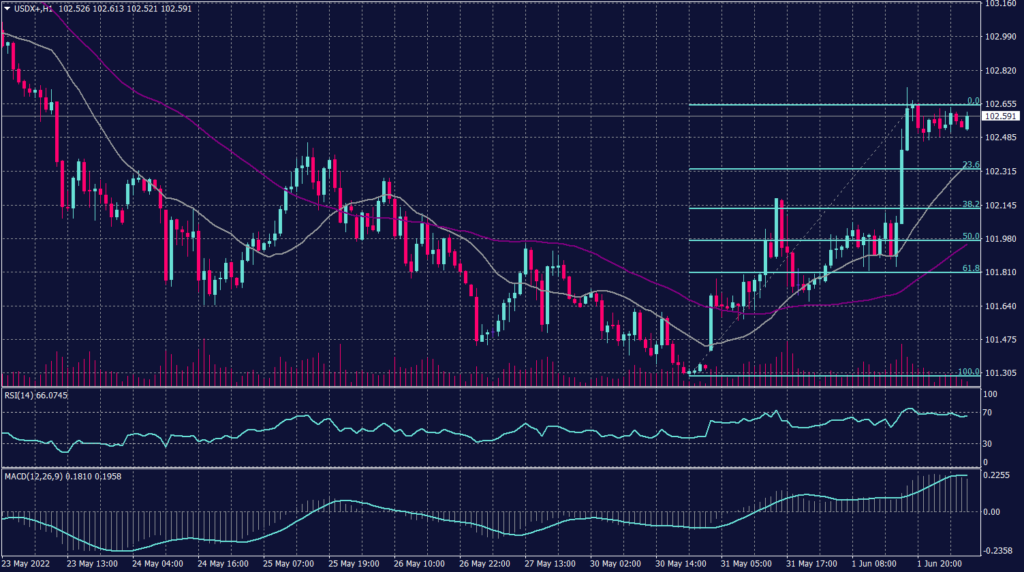
The U.S. benchmark 10-year yield hit a two-week high of 2.951% on Wednesday, with data showing U.S. manufacturing activity picked up in May 2022 as demand for goods remained strong. The manufacturing purchasing managers’ index (PMI) at 57 and the ISM manufacturing PMI was 56.1.
U.S. job openings also remained at high levels, with the Institute of Supply Management (ISM) manufacturing employment index at 49.6 and the JOLTs jobs opening index at 11.4 million. Yields have been on an upward trend as the U.S. Federal Reserve has hiked interest rates quickly to curb inflation and avoid an economic recession.
Technically:
The U.S. dollar index hit resistance at 102.60 on the hourly chart forming a retreating pattern, that targets 101.90. Meanwhile, on the daily chart, the USDX is trying to break out of the declining trend.
Additionally, the index trades above the 20 SMA and the 55 SMA which is a bullish signal, but price action indicates a likelihood of decline. Technical indicators also show a likelihood of further decline.
PIVOT POINT: 102.50
| SUPPORT | RESISTANCE |
| 101.90 | 102.60 |
| 101.60 | 102.80 |
| 101.30 | 103.00 |
Euro (EURUSD)
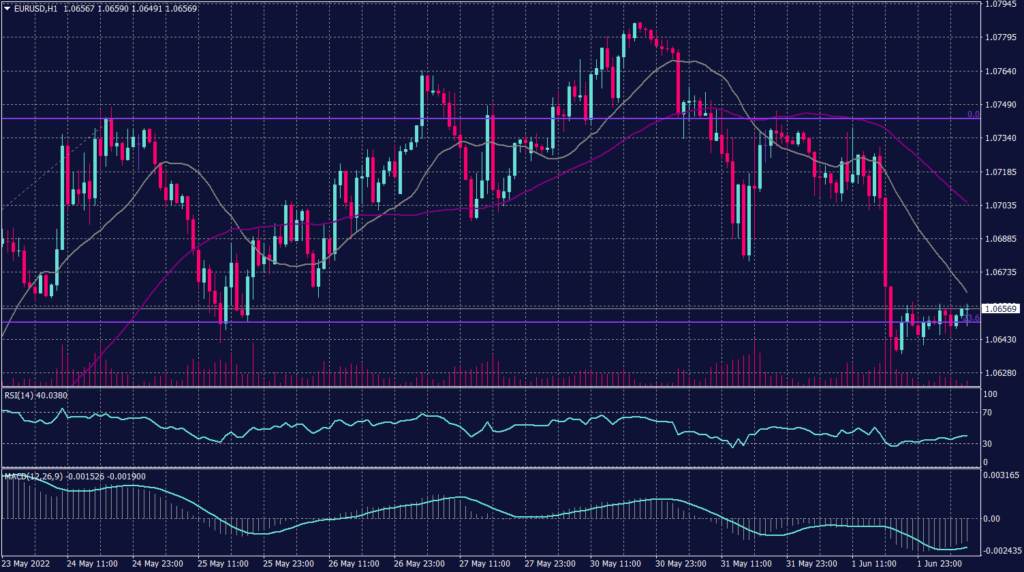
The common currency fell by 0.10% to its lowest rate in over a week hitting the support of 1.0650 while indicating a change in direction.
However, Fibonacci retracement shows support at 1.0650 while technical indicators show a possibility to reach 1.0700. Though, the 20 SMA moving average on the daily chart remains above the price level while the 55 SMA is below, which indicates a swing and hovering between these levels.
PIVOT POINT: 1.0650
| SUPPORT | RESISTANCE |
| 1.0610 | 1.0710 |
| 1.0580 | 1.0730 |
| 1.0550 | 1.0750 |
Sterling Pounds (GBPUSD)
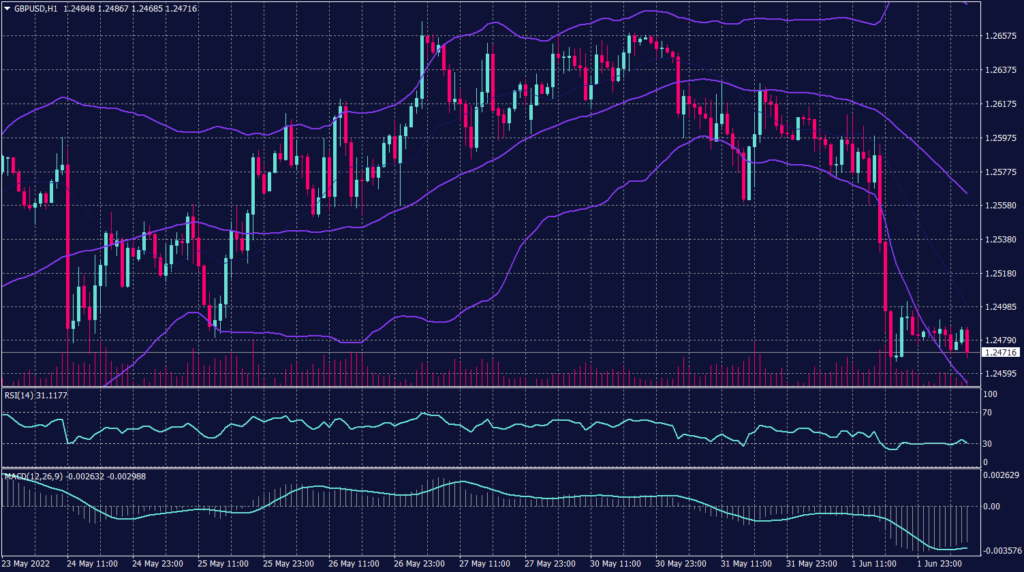
The Sterling pound is trading below the 20 SMA and 55 SMA on the hourly char indicating further decline, meanwhile, the Cable is moving alongside the lower band signaling a likelihood of a bounce towards 1.2570.
In the meantime, on the Daily chart, the pair is trading between the 20 SMA and 55 SMA, indicating further advance in the longer time frame, and remains near the daily resistance of 1.2610.
PIVOT POINT: 1.2500
| SUPPORT | RESISTANCE |
| 1.2480 | 1.2540 |
| 1.2450 | 1.2570 |
| 1.2400 | 1.2600 |
Japanese Yen (USDJPY)
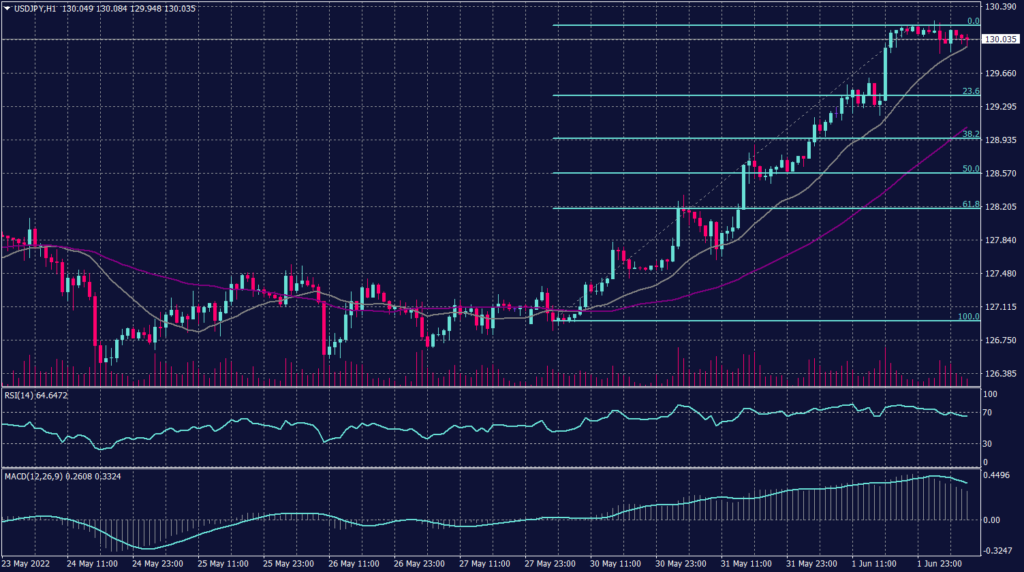
The Japanese Yen continued its losses hitting a floor at 130.20 and recording the weakest level in three weeks, the pair found resistance at 130 and started forming a declining pattern. On the daily chart, the USDJPY is likely to return to the main uptrend targeting 131.30 in case it broke above 130.20.
Though, Technical indicators on both the hourly and the daily charts are easing and signaling a change in the trend. that the pair is slowing the fall as the U.S. dollar buying activities provide support but keeps the possibility of a slight decline towards 126.70.
PIVOT POINT: 129.60
| SUPPORT | RESISTANCE |
| 128.65 | 130.00 |
| 128.10 | 130.20 |
| 127.80 | 130.60 |
Spot Gold (XAUUSD)
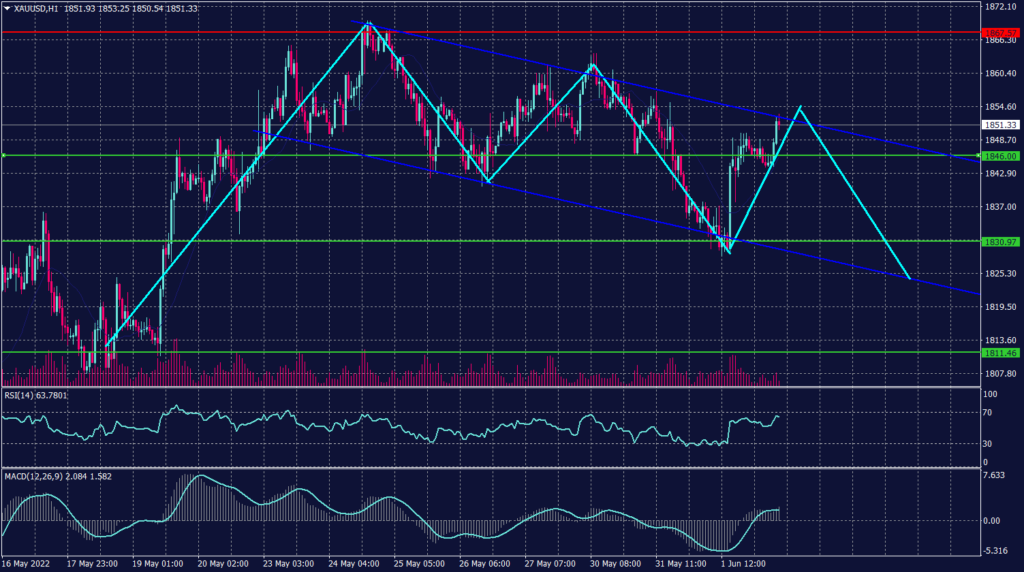
Gold inched up to $1,853 and is down about 2.4% in the month to date, the most since September 2021. In the hourly chart, spot gold prices are swinging inside the downward regression channel following a soft slope, gold prices are set to touch 1,854 before it starts retreating towards 1,824 following the slope of the regression channel.
On the daily chart, the precious metal returns to its primary decline trend targeting the resistance at 1,810 and 1,790. However, spot gold shows a change in direction and signals further decline below the support at 1,842 during the day.
PIVOT POINT: 1,850
| SUPPORT | RESISTANCE |
| 1,830 | 1,854 |
| 1,824 | 1,860 |
| 1,810 | 1,866 |
West Texas Crude (USOUSD)
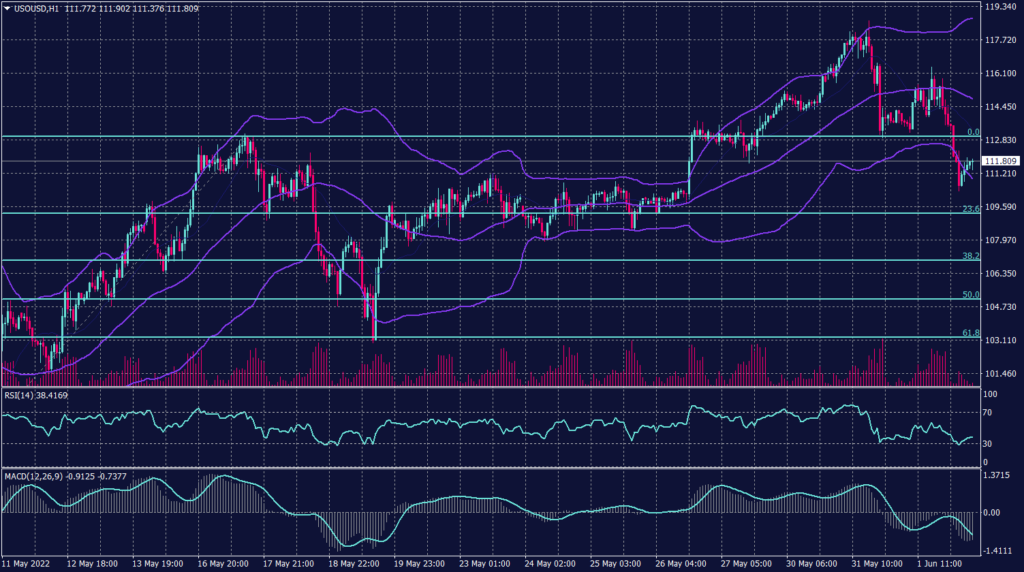
Oil was down $3 a barrel during the morning trades as investors closed the gains from the recent rally. Additionally, supply worries rise with OPEC and allies meeting later in the day is set to pave the way for expected output increases.
China’s easing of some COVID-19 lockdowns has added to price support, but a strengthening U.S. dollar limited the black gold gains. Meanwhile, Wednesday’s U.S. crude oil supply from the American Petroleum Institute showed a draw of 1.181 million barrels for the week ended May 26. Investors now await crude oil supply from the U.S. Energy Information Administration, due later in the day.
Brent oil fell 1.69% to $114.33 after gaining 0.6% during the previous session. WTI slid 1.87% to $113.10, after gaining 0.5% on Wednesday. Both Brent and WTI futures have been on an upward trend for several weeks, as European Union and U.S. sanctions against Russia over its invasion of Ukraine on Feb. 24 squeezed Russian exports.
Technically:
WTI fell from 116.33 yesterday to 110.30 early this morning, losing a total of $6 overall and $3 only during the Asian sessions.
However, as was mentioned yesterday, the crude oil reflected market correction from Bollinger Bands readings. Today WTI is likely to swing to the same level as the 55 SMA at 114.50. Fibonacci retracement shows firm support at 109.50 and is stronger if held above 113.40. RSI is showing WTI is oversold, while MACD shows a continuation of the decline.
PIVOT POINT: 111.50
| SUPPORT | RESISTANCE |
| 110.20 | 113.40 |
| 109.50 | 114.45 |
| 108.30 | 115.00 |
Tags
Open Live Account
Please enter a valid country
No results found
No results found
Please enter a valid email
Please enter a valid verification code
1. 8-16 characters + numbers (0-9) 2. blend of letters (A-Z, a-z) 3. special characters (e.g, !a#S%^&)
Please enter the correct format
Please tick the checkbox to proceed
Please tick the checkbox to proceed
Important Notice
STARTRADER does not accept any applications from Australian residents.
To comply with regulatory requirements, clicking the button will redirect you to the STARTRADER website operated by STARTRADER PRIME GLOBAL PTY LTD (ABN 65 156 005 668), an authorized Australian Financial Services Licence holder (AFSL no. 421210) regulated by the Australian Securities and Investments Commission.
CONTINUEImportant Notice for Residents of the United Arab Emirates
In alignment with local regulatory requirements, individuals residing in the United Arab Emirates are requested to proceed via our dedicated regional platform at startrader.ae, which is operated by STARTRADER Global Financial Consultation & Financial Analysis L.L.C.. This entity is licensed by the UAE Capital Market Authority (CMA) under License No. 20200000241, and is authorised to introduce financial services and promote financial products in the UAE.
Please click the "Continue" button below to be redirected.
CONTINUEError! Please try again.

