


market news summary
U.S. Dollar into correction;
Traders hunt Safe Havens;
Crude oil fluctuates;
Euro declines.
U.S. Dollar Index (USDX)
The U.S. Dollar wobbled slightly yesterday but it returned to trade up this morning amid an increased tendency for safe havens. The Federal Reserve is set to start shrinking its $8.9 trillion balance sheet while investors await the unemployment and non-farm data due on Friday.
Technically:
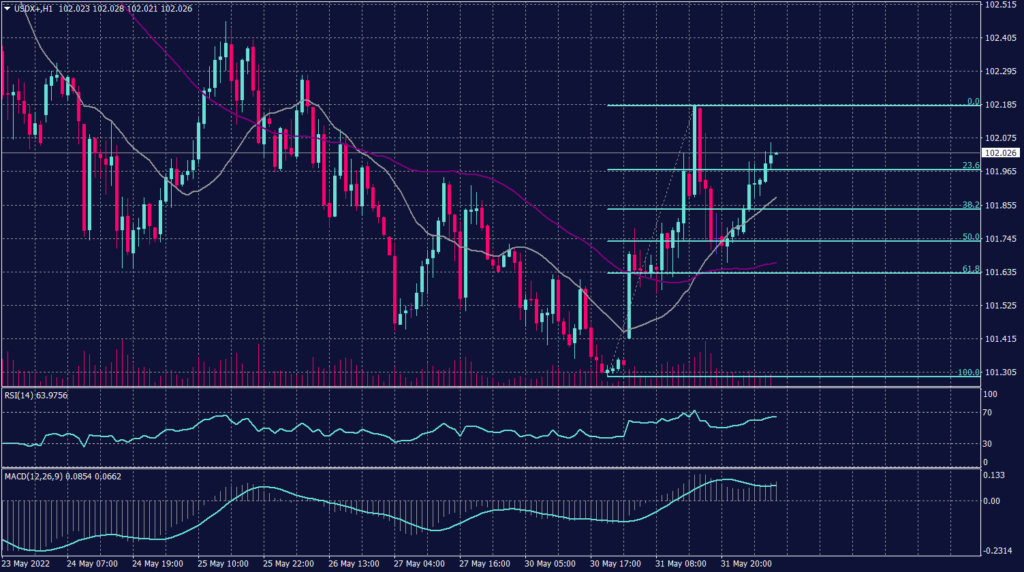
The U.S. Dollar index goes higher today breaking out of the downward channel and trading near 102 slightly below the resistance of 102.20. Additionally, the index trades at the 20 periods SMA and above the 55 periods SMA but price action indicates a likelihood of a rise if prices penetrated above 102.20. Technical indicators show a likelihood of further decline.
PIVOT POINT: 101.95
| SUPPORT | RESISTANCE |
| 101.70 | 102.20 |
| 101.60 | 102.40 |
| 101.30 | 103.00 |
Euro (EURUSD)
The common currency retreated further this morning but remains to hold the record for the best-performing month this year. Additionally, the surge in interest rate expectations in Europe and economic slow in the U.S. boosted the common currency.
The increase in crude oil prices will be adding further pressure on the European currency and the European central bank.
Technically:
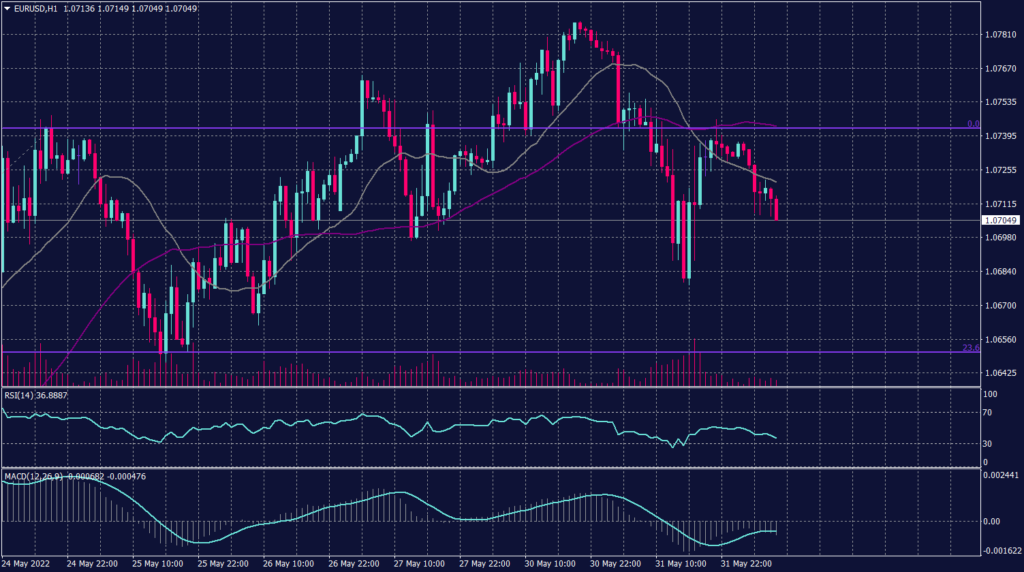
The EURUSD pair has further retreated to trade around 1.0720 as energy prices are rocket flying. The European currency lost another 0.3% from a five-week high of 1.0786 recorded on Monday. Moreover, the euro is set for a 2.2% gain in May, which would be its biggest monthly rise in a year.
However, Fibonacci retracement shows slight support at 1.0720 while technical indicators show a possibility to reach 1.0700. Though, the 20 periods moving average on the daily chart remains above the price level while the 55 SMA is below, which indicates a further decline.
PIVOT POINT: 1.0710
| SUPPORT | RESISTANCE |
| 1.0610 | 1.0740 |
| 1.0550 | 1.0840 |
| 1.0510 | 1.0910 |
Sterling Pounds (GBPUSD)
The Sterling pound shrinks under the pressure of inflation and energy costs, despite the efforts of BoE to control the inflationary effects. Market participants’ concerns about the BOE’s plan to cope with inflation are increasing, while figures show that is not enough. Despite four interest-rate increases since December and money markets bracing for more in each of its next five decisions, the pound is one of the worst-performing major currencies this year.
Technically:
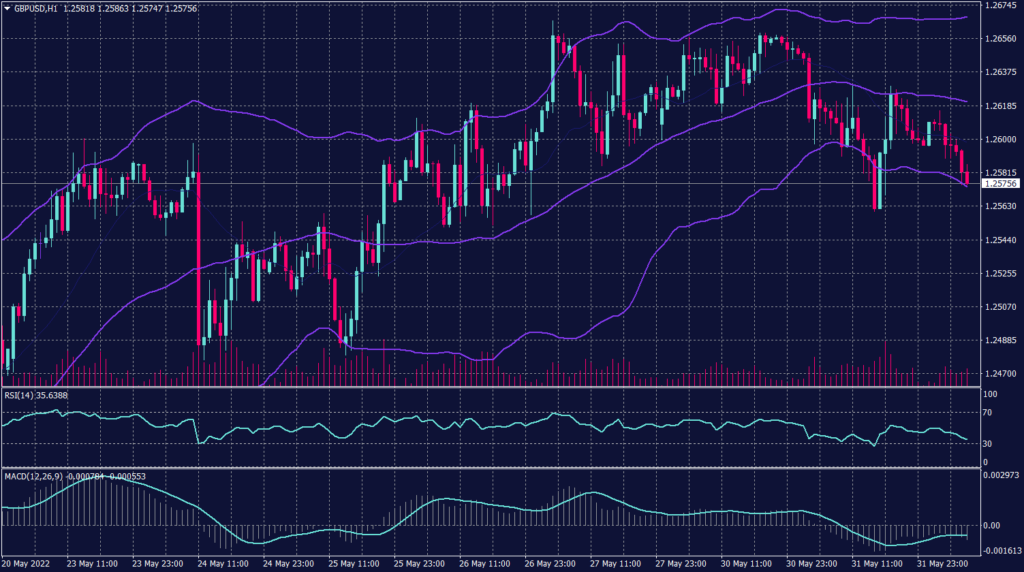
The sterling pound swings between the 55 SMA and the lower band of the Bollinger Bands (1 standard deviation) to touch it for the second time on the hourly chart testing the support of 1.2580. Meanwhile, on the Daily chart, the pair is trading between the 20 SMA and 55 SMA and indicating further advance in the longer time frame and remains near the daily resistance of 1.2610.
PIVOT POINT: 1.2590
| SUPPORT | RESISTANCE |
| 1.2560 | 1.2600 |
| 1.2520 | 1.2620 |
| 1.2490 | 1.2660 |
Japanese Yen (USDJPY)
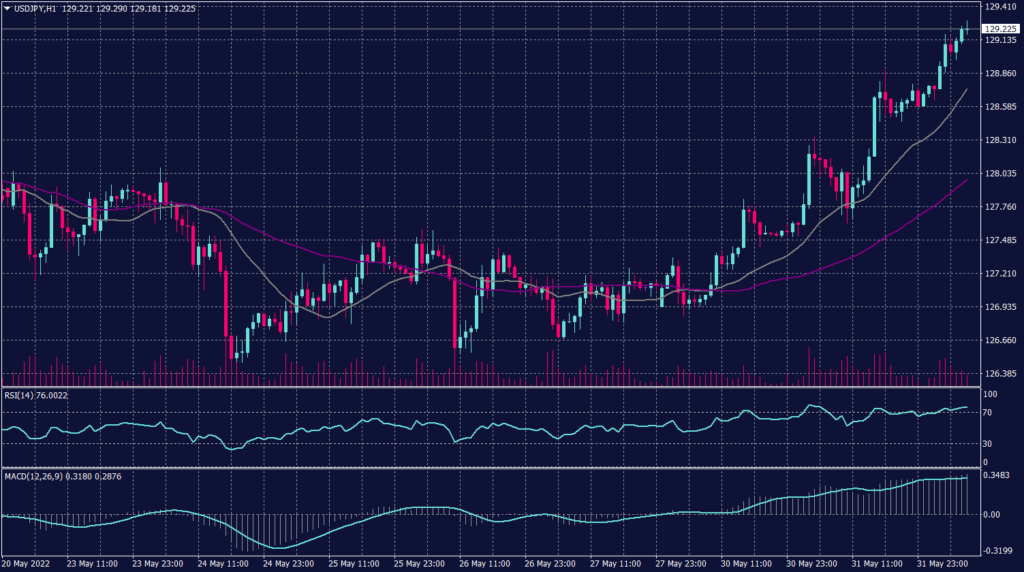
The Japanese Yen loses hard against the greenback and reached the weakest level in ten days. On the daily chart, the USDJPY shows a correction pattern bouncing from one month low of 126.35 last week to 129.29 this morning.
Though, Technical indicators on both the hourly and the daily charts are easing and signalling a change in the trend. that the pair is slowing the fall as the U.S. dollar buying activities provide support but keeps the possibility of a slight decline towards 126.70.
PIVOT POINT: 129.30
| SUPPORT | RESISTANCE |
| 128.65 | 129.60 |
| 128.10 | 130.20 |
| 127.80 | 130.60 |
Spot Gold (XAUUSD)
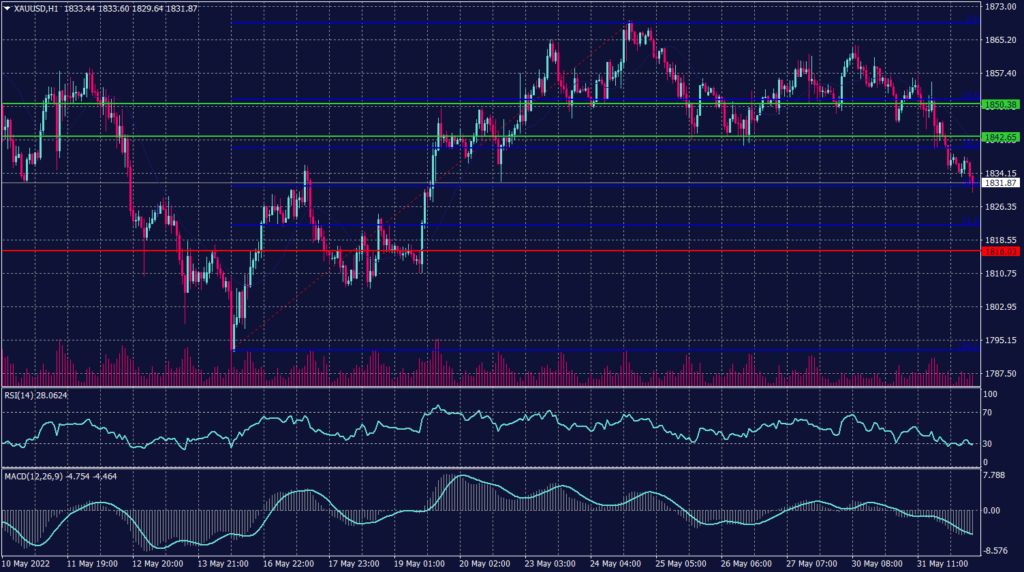
Gold futures inched lower to $1,829.64 and are down about 2.6% in the month to date, the most since September 2021. Similarly, other precious metals also declined this morning, silver fell 0.7%, platinum fell 0.8%, and palladium eased 0.2%.
On the hourly chart, the precious metals traded in a downtrend and broke below the support of 1,850. However, spot gold shows a change in direction and signals further decline as it broke below the support at 1,842.
PIVOT POINT: 1,835
| SUPPORT | RESISTANCE |
| 1,830 | 1,837 |
| 1,820 | 1,845 |
| 1,800 | 1,850 |
West Texas Crude (USOUSD)
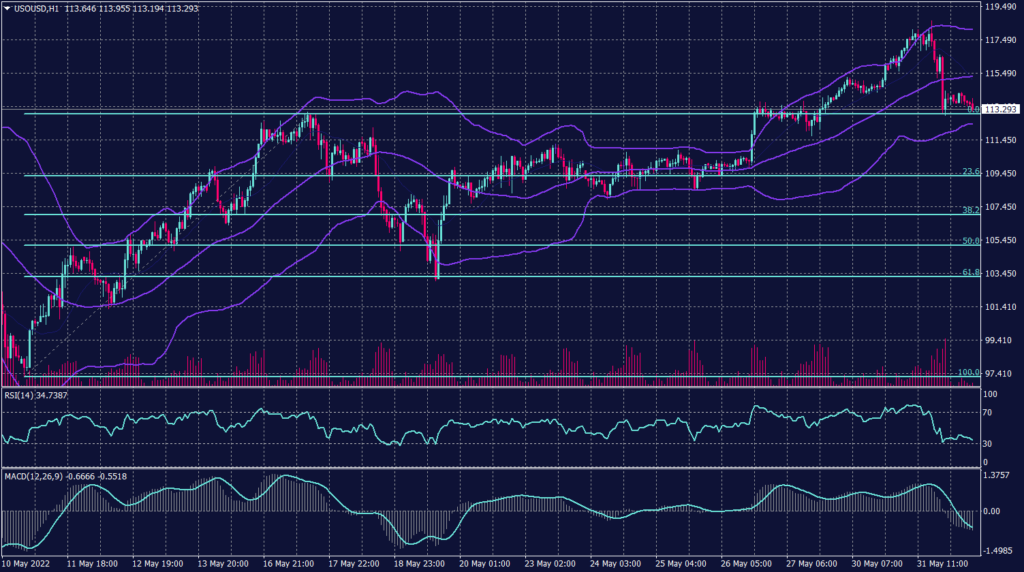
Oil prices gained slightly on Wednesday after European Union leaders agreed to a partial and phased ban on Russian oil and as China ended its COVID-19 lockdown in Shanghai.
Brent crude for August delivery was up 28 cents, or 0.2%, at $115.88 a barrel. The contract settled down 1.7% on Tuesday. The front-month contract for July delivery expired on Tuesday at $122.84 a barrel, up 1%. U.S. West Texas Intermediate (WTI) crude rose 30 cents, or 0.3%, to $114.97 a barrel. Both benchmarks ended May higher, marking the sixth straight month of rising prices
Technically:
WTI built support above 113.40 on the hourly chart after bouncing from the resistance at 117.50. However, as was mentioned yesterday, the crude oil reflected market correction from Bollinger Bands readings. Today WTI is likely to swing between 113.50 and 115.50 to the same level as the 55 SMA. Fibonacci retracement shows firm support above 113.40. RSI is showing WTI is oversold, while MACD shows a continuation.
PIVOT POINT: 114.60
| SUPPORT | RESISTANCE |
| 113.50 | 115.50 |
| 112.40 | 116.50 |
| 110.25 | 117.30 |
Tags
Open Live Account
Please enter a valid country
No results found
No results found
Please enter a valid email
Please enter a valid verification code
1. 8-16 characters + numbers (0-9) 2. blend of letters (A-Z, a-z) 3. special characters (e.g, !a#S%^&)
Please enter the correct format
Please tick the checkbox to proceed
Please tick the checkbox to proceed
Important Notice
STARTRADER does not accept any applications from Australian residents.
To comply with regulatory requirements, clicking the button will redirect you to the STARTRADER website operated by STARTRADER PRIME GLOBAL PTY LTD (ABN 65 156 005 668), an authorized Australian Financial Services Licence holder (AFSL no. 421210) regulated by the Australian Securities and Investments Commission.
CONTINUEImportant Notice for Residents of the United Arab Emirates
In alignment with local regulatory requirements, individuals residing in the United Arab Emirates are requested to proceed via our dedicated regional platform at startrader.ae, which is operated by STARTRADER Global Financial Consultation & Financial Analysis L.L.C.. This entity is licensed by the UAE Capital Market Authority (CMA) under License No. 20200000241, and is authorised to introduce financial services and promote financial products in the UAE.
Please click the "Continue" button below to be redirected.
CONTINUEError! Please try again.

