


market news summary
U.S. Dollar Index (USDX)
Total nonfarm payroll employment rose by 390,000 in May, and the unemployment rate remained at 3.6%, the U.S. Bureau of Labor Statistics reported on Friday. Notable job gains occurred in leisure and hospitality, professional and business services, and transportation and warehousing. Employment in retail trade declined.
In May, the unemployment rate was 3.6 percent for the third month in a row, and the number of unemployed persons was essentially unchanged at 6.0 million. These measures are little different from their values in February 2020 (3.5 percent and 5.7 million, respectively), before the coronavirus (COVID-19) pandemic.
Technically:
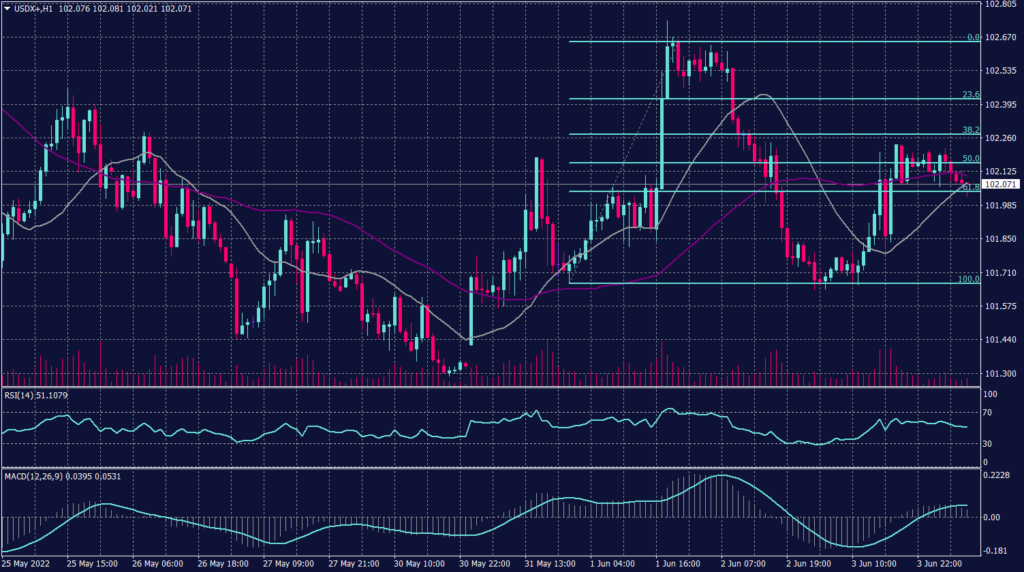
The U.S. dollar index fluctuated between the resistance of 102.60 and the support of 101.60. Meanwhile, on the daily chart, the USDX is trying to break away from the declining trendline, but it remains bearish for the time being.
On the hourly chart, 20 SMA and 55 SMA intersect, and both are above the current price range which signals a slight fluctuation on the way down.
PIVOT POINT: 101.90
| SUPPORT | RESISTANCE |
| 101.60 | 102.30 |
| 101.30 | 102.60 |
| 101.40 | 102.80 |
Euro (EURUSD)
In Europe, ECB President Christine Lagarde outlined her plan a couple of weeks ago to raise rates out of the negative territory, suggesting the central bank’s minus 0.5% deposit rate should start rising in July and could be at zero or “slightly above” by the end of September before rising further “towards the neutral rate.”
Furthermore, EURUSD moved horizontally this morning after declining amid the U.S. employment data on Friday. Meanwhile, the recent U.S. news raised further expectations for more rate hikes.
Technically:
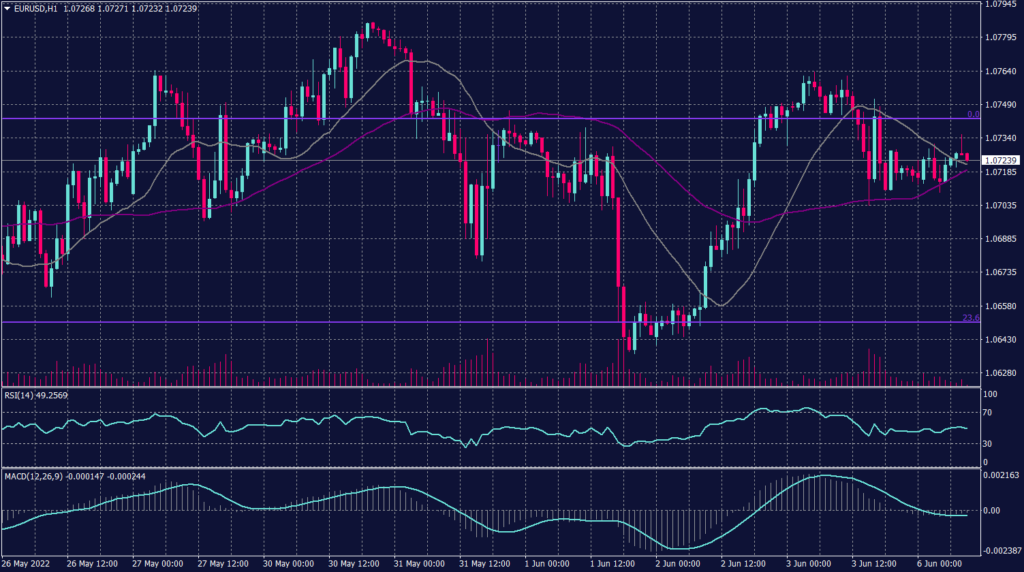
Fibonacci retracement shows resistance1.0750 while technical indicators show a possibility of a decline. Though, moving averages show a horizontal movement and set support at 1.0700.
PIVOT POINT: 1.0720
| SUPPORT | RESISTANCE |
| 1.0700 | 1.0790 |
| 1.0650 | 1.0830 |
| 1.0610 | 1.0900 |
Spot Gold (XAUUSD)
Gold was up on Monday morning in Asia even as the U.S. jobs report signaled more interest rate increases this year that could weigh on non-yielding bullion.
Besides, investors await the release of the U.S. CPI report for May as this will be a key input before the Fed decides how much to hike rates next week. Core inflation, which excludes volatile energy and fuel prices, is expected to come in at 5.9% year-over-year, which would mark the third month of consecutive declines and make the case that core inflation may have peaked.
The Federal Reserve is on track for half a point interest rate increases in June, July, and perhaps even beyond since fresh job market data showed no sign of the U.S. economy falling under high inflation and rising borrowing costs.
Gold futures were up 0.32% to $1856.20. It has traded between $1,828 and $1,864 for the past week, remaining at an average of $1,850 overall.
Technically:
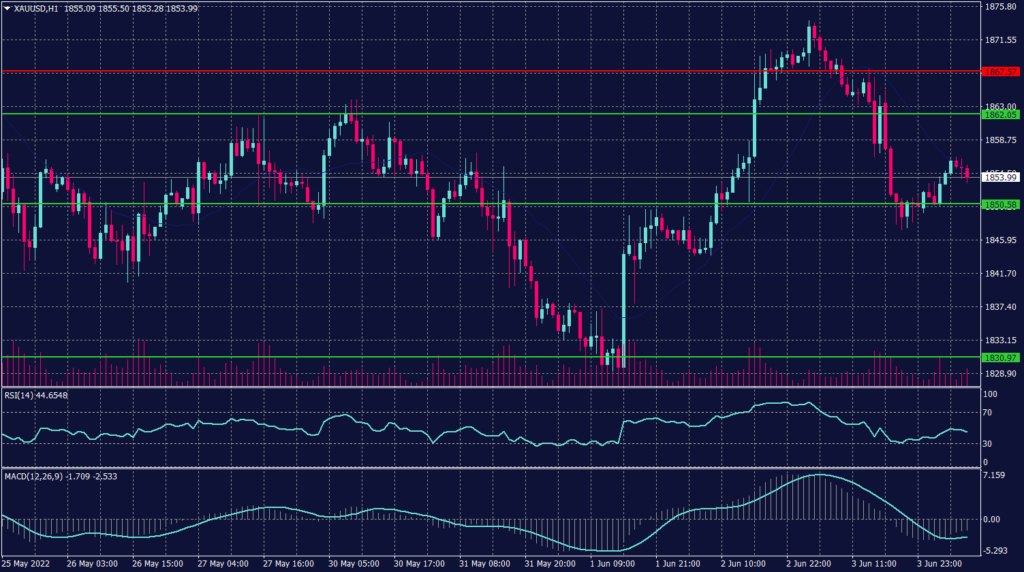
Gold jumped yesterday reaching above 1,870 on Friday and it started to retreat to 1,847. Gold prices are set for a decline towards 1,810 on the daily chart. Meanwhile, in the hourly chart, spot gold penetrated out of the regression channel, but it remains set to decline.
On the daily chart, the precious metal returns to its primary decline trend targeting the resistance at 1,810 and 1,790. However, spot gold shows a change in direction and signals further decline below the support at 1,842 during the day.
PIVOT POINT: 1,852
| SUPPORT | RESISTANCE |
| 1,842 | 1,866 |
| 1,837 | 1,872 |
| 1,830 | 1,875 |
West Texas Crude (USOUSD)
Oil was down $3 a barrel during the morning trades as investors closed the gains from the recent rally. Additionally, supply worries rise with OPEC and allies meeting later in the day is set to pave the way for expected output increases.
China’s easing of some COVID-19 lockdowns has added to price support, but a strengthening U.S. dollar limited the black gold gains. Meanwhile, Wednesday’s U.S. crude oil supply from the American Petroleum Institute showed a draw of 1.181 million barrels for the week ended May 26. Investors now await crude oil supply from the U.S. Energy Information Administration, due later in the day.
Brent oil fell 1.69% to $114.33 after gaining 0.6% during the previous session. WTI slid 1.87% to $113.10, after gaining 0.5% on Wednesday. Both Brent and WTI futures have been on an upward trend for several weeks, as European Union and U.S. sanctions against Russia over its invasion of Ukraine on Feb. 24 squeezed Russian exports.
Technically:
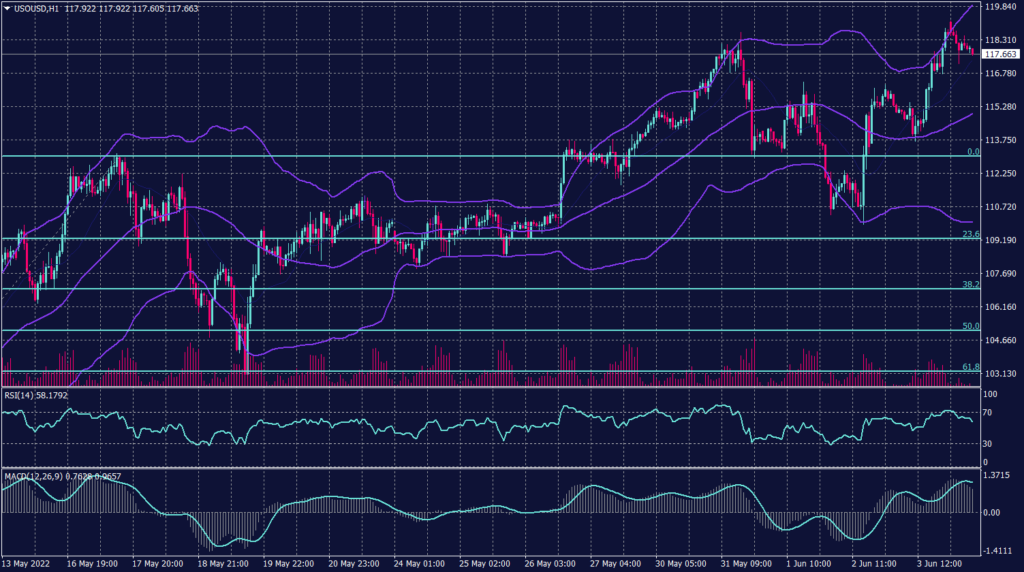
WTI started retreating after touching the upper band in the Bollinger Bands and started closing towards the 55 SMA in a slow fashion.
However, today WTI is likely to swing to the same level as the 55 SMA at 115. Fibonacci retracement shows firm support at 115 and is stronger if held above 113.40. RSI is showing WTI is oversold, while MACD shows a continuation of the decline.
PIVOT POINT: 117.00
| SUPPORT | RESISTANCE |
| 115.00 | 119.00 |
| 109.50 | 120.00 |
| 108.30 | 123.00 |
Tags
Open Live Account
Please enter a valid country
No results found
No results found
Please enter a valid email
Please enter a valid verification code
1. 8-16 characters + numbers (0-9) 2. blend of letters (A-Z, a-z) 3. special characters (e.g, !a#S%^&)
Please enter the correct format
Please tick the checkbox to proceed
Please tick the checkbox to proceed
Important Notice
STARTRADER does not accept any applications from Australian residents.
To comply with regulatory requirements, clicking the button will redirect you to the STARTRADER website operated by STARTRADER PRIME GLOBAL PTY LTD (ABN 65 156 005 668), an authorized Australian Financial Services Licence holder (AFSL no. 421210) regulated by the Australian Securities and Investments Commission.
CONTINUEImportant Notice for Residents of the United Arab Emirates
In alignment with local regulatory requirements, individuals residing in the United Arab Emirates are requested to proceed via our dedicated regional platform at startrader.ae, which is operated by STARTRADER Global Financial Consultation & Financial Analysis L.L.C.. This entity is licensed by the UAE Capital Market Authority (CMA) under License No. 20200000241, and is authorised to introduce financial services and promote financial products in the UAE.
Please click the "Continue" button below to be redirected.
CONTINUEError! Please try again.

