








 Web Trader MT5













Key Takeaways
- The U.S.–Iran war became the dominant market driver in March, triggering volatility across all asset classes and reshaping global risk sentiment.
- Global stock markets entered correction territory, with major U.S. indices falling more than 10% from recent highs.
- Oil prices surged above $100, reaching multi-year highs amid supply disruption fears linked to the Strait of Hormuz.
- The U.S. dollar strengthened significantly, becoming the primary safe-haven asset instead of gold.
- Gold and silver declined despite geopolitical tensions, as strong USD and rising yields reduced their appeal.
- Inflation concerns intensified, driven by energy prices, forcing markets to reassess central bank rate cut expectations.
- Crypto markets remained unstable, fluctuating in response to macro uncertainty and shifting risk appetite.
Global Stock Markets Enter Correction Phase
Fundamental Look
March was marked by a clear shift from bullish momentum to corrective pressure across global equities.
U.S. markets experienced one of their weakest months in over a year, with the Dow Jones, S&P 500, and Nasdaq all entering correction territory as geopolitical risks escalated.
The key driver behind the sell-off was the surge in oil prices and resulting inflation fears, which raised concerns about prolonged higher interest rates and slower economic growth. Investors began pricing in a potential stagflation scenario, where growth slows while inflation remains elevated.
Global markets followed the same pattern. European indices declined amid energy dependency concerns. Asian markets weakened due to capital outflows and risk aversion
Overall, March marked a transition from expansion to caution, with equities losing momentum under macro pressure.
Technical Forecast
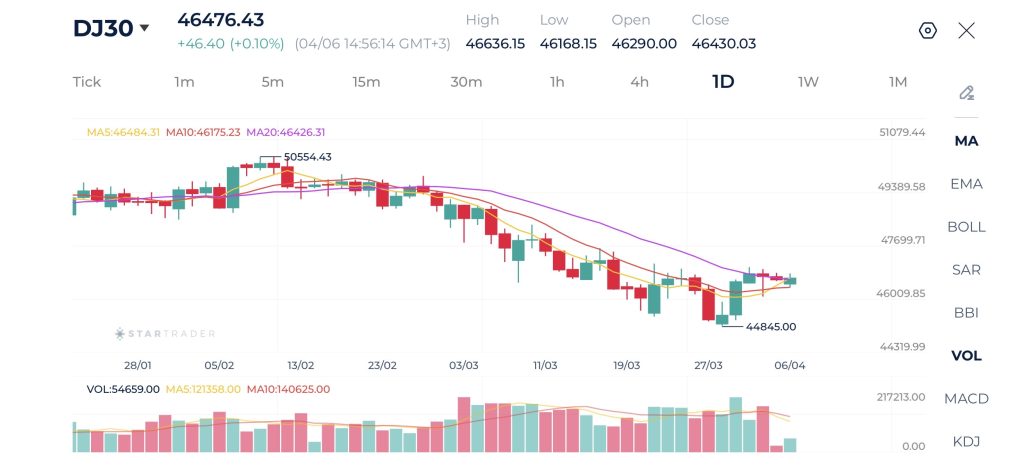
Dow Jones is trading near 46,500 and continues to show signs of stabilization on the daily timeframe after a prolonged bearish correction from the 50,550 highs. The market structure remains technically bearish in the broader sense, as price is still trading below the 100 and 200 moving averages, but recent price action indicates the formation of a potential base around the 44,845 region.
The rebound from this level has produced a sequence of higher lows, suggesting early signs of a trend shift or at least a corrective bounce. Price is currently testing the 46,500–46,800 resistance zone, where previous breakdowns occurred, making it a key decision area.
A sustained break above this zone would signal a stronger recovery toward 47,500–48,000. On the downside, failure to hold above 46,000 could lead to renewed selling pressure and a retest of the 44,800 support. The current structure reflects a transition phase between bearish correction and potential recovery.
Gold and Silver Weakened Despite Geopolitical Risk
Fundamental Look
One of the most notable anomalies of March was the behavior of precious metals. Despite a major geopolitical conflict, gold and silver declined instead of rallying strongly, breaking the typical safe-haven pattern.
The main reasons were: strong U.S. dollar absorbing safe-haven flows, rising real yields reducing gold’s attractiveness, and profit-taking after previous record highs.
Gold saw sharp corrections during parts of the month, occasionally rebounding on short-term geopolitical headlines but failing to establish a sustained upward trend.
Technical Forecast
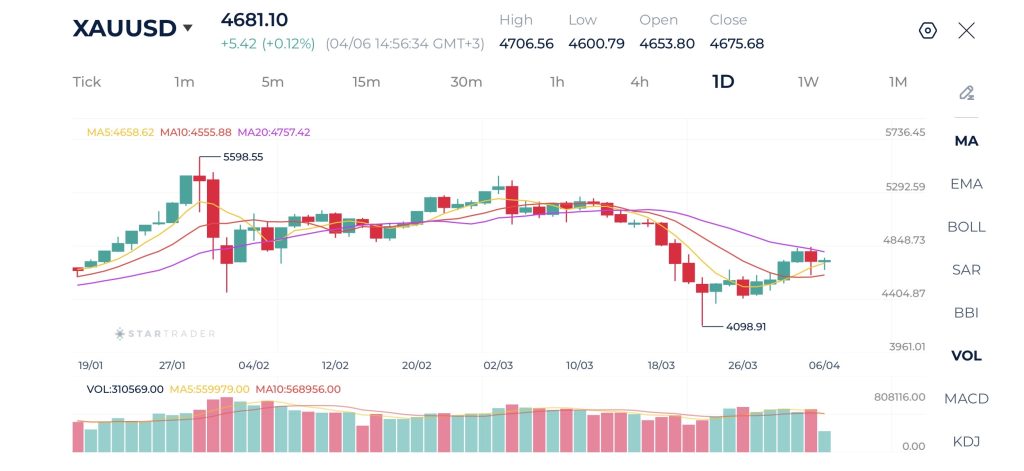
Gold is trading around $4,700 and is currently attempting to recover after a strong corrective decline that pushed prices down toward the $4,100 region. On the daily timeframe, the broader structure still reflects a medium-term bullish trend, but the recent rejection from the $5,500 high triggered a deep pullback, bringing price below key moving averages before stabilizing.
Currently, price is reclaiming the 20 and 50 moving averages, which are starting to flatten and turn slightly upward, indicating that bullish momentum is gradually rebuilding. However, the 100-period moving average remains above price, acting as dynamic resistance around the $4,750–$4,800 zone. The recovery appears constructive, with higher lows forming, suggesting that buyers are regaining control.
As long as price holds above the $4,550–$4,600 support zone, the market could continue higher toward $4,800. A break above this resistance would confirm a continuation of the broader uptrend, while a failure could lead to renewed consolidation or another leg lower.
Oil Surged Above $100, Leading to an Energy Shock
Fundamental Look
Oil was the central driver of global markets throughout March. Prices surged aggressively, with Brent crude rising above $110–$115, and WTI crude consistently trading above $100. The primary catalyst was the disruption of supply routes through the Strait of Hormuz, a critical global energy chokepoint. This created a significant geopolitical risk premium, pushing oil prices higher and feeding directly into global inflation expectations.
The oil rally had widespread consequences, mainly increased production costs globally, rising fuel prices impacting consumers, and strong upward pressure on inflation. Oil effectively became the core transmission channel through which the war impacted financial markets.
Technical Forecast
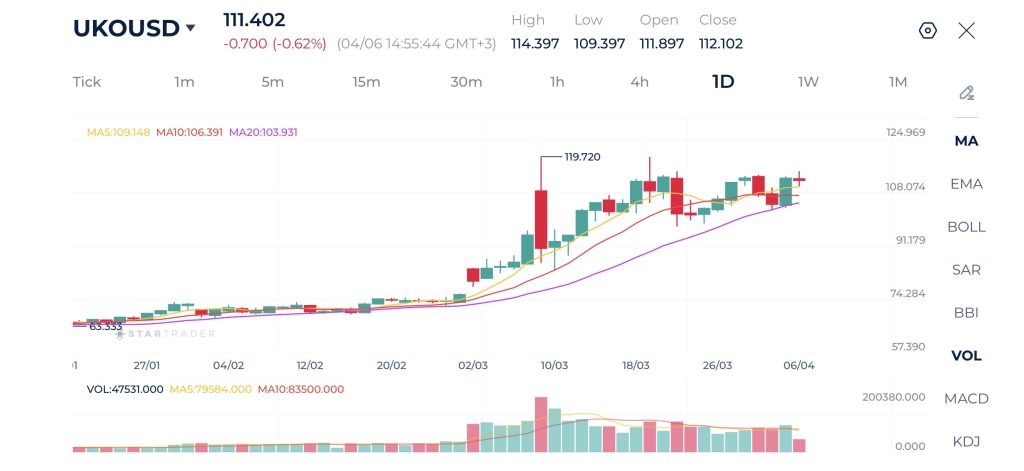
Brent crude is trading around $111.40 and remains in a strong overall uptrend despite a recent pullback. The daily chart shows a clear bullish structure with higher highs and higher lows, supported by well-aligned moving averages, where the 20 MA remains above the 50 MA and both are above the 100 MA.
The recent strong pullback appears to be a healthy correction within an ongoing uptrend. As long as price holds above this support zone, the bullish bias remains intact, with potential for another move toward $115 and eventually a retest of $119.70. However, a break below $108 would signal a deeper correction toward the $104–$102 region, where stronger demand is expected to emerge.
Outlook for April 2026
Oil is expected to remain the primary driver of global markets heading into April. As long as the geopolitical conflict continues, prices are likely to stay elevated above the $100 level, maintaining upward pressure on inflation. However, any signs of de-escalation or diplomatic progress could trigger a sharp correction in oil prices, given how much risk premium is currently priced into the market.
Equity markets may attempt a technical rebound after entering correction territory in March, but the broader structure remains fragile. Inflation risks driven by high energy prices are likely to limit upside potential, as investors remain cautious about central banks maintaining tighter monetary policy for longer.
Precious metals are expected to remain under pressure in the near term, particularly if the U.S. dollar continues to strengthen. Gold and silver could struggle to gain momentum unless there is a clear shift in dollar direction or a decline in real yields. However, any escalation in geopolitical tensions could still provide intermittent support.
In the forex market, the U.S. dollar will remain a key focus. Its trajectory will largely depend on upcoming inflation data and central bank communication. A sustained break above the 100 level in the Dollar Index could reinforce further weakness in major currency pairs such as EURUSD and GBPUSD.
The cryptocurrency market is likely to remain highly sensitive to broader macro conditions. Any recovery will depend on improving risk sentiment and increased liquidity, while downside risks remain if global uncertainty and financial tightening persist.
Final Insight
March 2026 marked a clear turning point in global markets, as the combination of war, rising oil prices, and inflation fears triggered a broad correction across risk assets. At the same time, the U.S. dollar emerged as the dominant safe haven, replacing traditional flows into gold.
As April begins, markets are entering a fragile and highly reactive phase. Direction will be heavily influenced by geopolitical developments and inflation dynamics, with volatility expected to remain elevated across all major asset classes.
Risk Disclaimer: This material is provided for informational purposes only and does not constitute a recommendation or investment advice. Trading financial instruments on margin involves substantial risk and may not be appropriate for all investors.
Tags


Open Live Account
 Email Address
 Phone Number
Important Notice
STARTRADER does not accept any applications from Australian residents.
To comply with regulatory requirements, clicking the button will redirect you to the STARTRADER website operated by STARTRADER PRIME GLOBAL PTY LTD (ABN 65 156 005 668), an authorized Australian Financial Services Licence holder (AFSL no. 421210) regulated by the Australian Securities and Investments Commission.
Important Notice for Residents of the United Arab Emirates
In alignment with local regulatory requirements, individuals residing in the United Arab Emirates are requested to proceed via our dedicated regional platform at startrader.ae, which is operated by STARTRADER Global Financial Consultation & Financial Analysis L.L.C.. This entity is licensed by the UAE Capital Market Authority (CMA) under License No. 20200000241, and is authorised to introduce financial services and promote financial products in the UAE.
Please click the "Continue" button below to be redirected.


