








 Web Trader MT5













Key Factors
- Gold and risk premium
- Fed rate cut expectations rising amid softer growth and policy uncertainty.
- Geopolitical risks and central bank buying underpin long-term demand.
- Dollar data-dependent
- Data-driven Fed outlook fuels volatility after sharp multi-year decline.
- Fed independence concerns and leadership change skew risks dovish.
- Equities and easing optimism
- Rate cut optimism supports valuations despite stretched tech leadership.
- Political, trade and Fed leadership risks cap upside momentum.
- Oil supply volatility
- Oversupply fears grow amid Venezuela, Iran and OPEC+ output.
- Geopolitical tensions offer support but fail to offset structural glut.
Gold
Fundamental Outlook
Gold has entered 2026 with renewed strength, extending a rally that delivered its best annual performance in more than four decades. After rising 64% in 2025, bullion is benefiting from a familiar but still solid mix of catalysts: expectations of further Fed easing, persistent geopolitical uncertainty and structurally strong demand from central banks and ETF investors. The rebound at the start of the year also reflects a clearing of year-end technical pressures, allowing underlying fundamentals to reassert themselves.
Looking ahead to the coming month, the outlook for gold remains constructive but increasingly sensitive to shifts in monetary policy expectations. Markets are currently pricing in at least two U.S. rate cuts this year, even as recent labour market data points to continued resilience. This tension is likely to keep gold volatile in the short term as each data release either reinforces or challenges the easing narrative. If inflation continues to soften without a sharp deterioration in growth, policymakers may be able to cut gradually, offering an environment that historically supports gold by keeping real yields contained.
At the same time, gold’s role as a strategic asset appears more entrenched than in past cycles. Central bank buying shows little sign of slowing, reflecting diversification away from the dollar and a desire for reserves insulated from geopolitical risk. That structural bid may help limit the depth of pullbacks in spite of short-term profit-taking. The metal is likely to trade with an upward bias with consolidation phases rather than sharp reversals as the broader trend still favors strength.
Technical Forecast
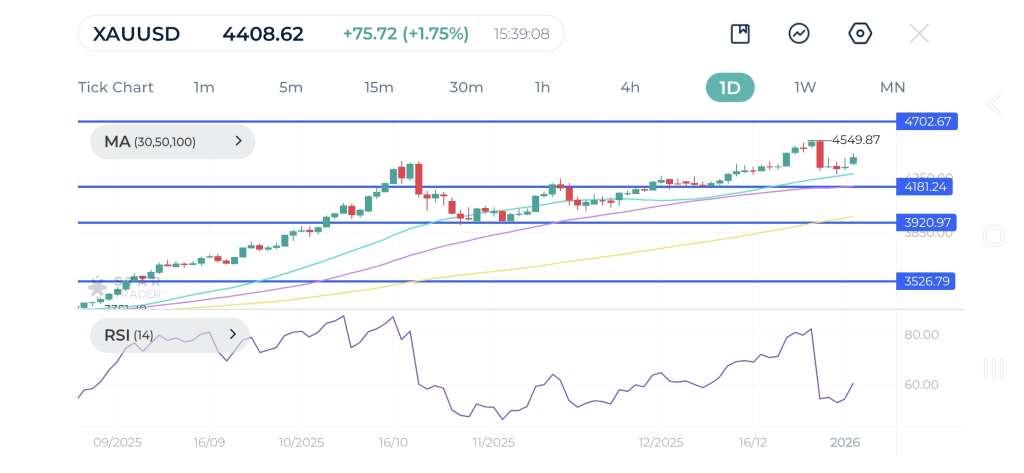
Gold’s daily chart points to a strong correction bias after the formation of a bearish engulfing candle, followed by successive bearish pin bars near the 20-day moving average around $4300. A bearish RSI divergence reinforces the downward outlook. A sustained move below this level could expose the 50-day MA at $4200, with further downside risk toward the confluence of the 100-day MA and the October swing low near $3900, a critical floor to keep buyers interested.
In the near term, sideways action may see the price moving in the $4200-4300 range. On the upside, a recovery back above the all-time highs of $4550 would likely attract fresh buying interest and set the stage for a move toward $4700. The RSI remains flat above the 50 mark, indicating a period of consolidation that could precede the next directional breakout.
U.S. Dollar
Fundamental Outlook
The U.S. dollar has started the new year on firmer ground, rebounding from its steepest annual decline since 2017 as investors reassess the outlook for the country’s monetary policy. Last year’s more than 9% slide reflected narrowing interest-rate differentials, fiscal concerns, trade frictions and questions over Federal Reserve independence, themes that have not disappeared but are now being weighed against fresh uncertainty about the economic trajectory. The near-term focus is firmly on the coming week’s heavy run of U.S. data, leading up to the payrolls report, which could reset expectations for how aggressively the Fed will ease this year.
The greenback’s direction is likely to remain data-dependent and volatile. Markets are pricing in two rate cuts in 2026, while the Fed’s own projections point to just one, highlighting a significant gap that upcoming figures on jobs, inflation and activity may either narrow or widen. Complicating matters is the lasting impact of the long government shutdown, which has distorted data quality and reduced confidence in headline releases, making conviction harder to build in either direction.
Political risk adds another layer. Trump is expected to name the next Fed chair this month, ahead of Jerome Powell’s term ending in May. A perceived shift toward a more dovish leadership could weigh on the dollar by reinforcing expectations of faster or deeper rate cuts, while also reviving concerns about central bank independence. Over the coming month, the greenback may retain some short-term support as investors wait for clarity, but its broader outlook remains fragile, with risks skewed toward renewed weakness if easing expectations cement.
Technical Forecast
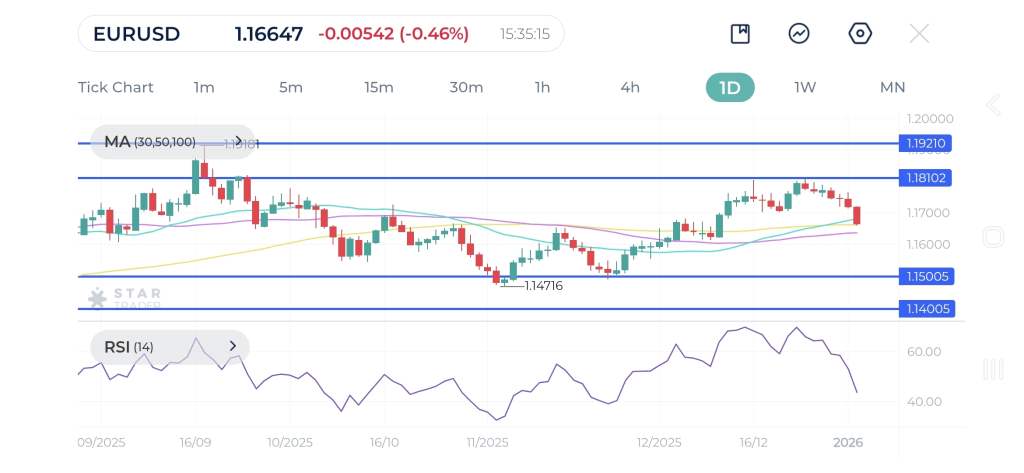
The EURUSD daily chart shows a resistance zone around 1.1810, a key inflection zone as the pair tries to recover to its previous 4-year high. On the downside, initial support is found at 1.1600-1.1655 near the December lows and the 50-day SMA. A decisive drop below this threshold would warn of a deeper corrective move toward the double bottom at 1.1500 from last November. This lower region acts as a significant technical support, an extension from July’s dip at 1.1400.
However, the broader bias remains tilted to the upside even though the slow rally may be vulnerable to a more pronounced correction in the short-term. A sustained close above 1.1810 may trigger the next major leg higher in the single currency, opening the door to 1.2000, last seen in June 2021.
Nasdaq 100
Fundamental Outlook
U.S. equities opened 2026 on a cautious but resilient note, extending a multiyear rally that has already delivered three consecutive years of double-digit gains. While the Dow and S&P 500 edged higher, the Nasdaq lagged despite strength in key semiconductor names, highlighting early signs of selectivity after a volatile but strong 2025. The muted start also reflects the market’s failure so far to generate a traditional Santa Claus rally, suggesting investors are entering the new year more sensible than euphoric.
Still, optimism remains the dominant baseline underpinned by expectations of continued earnings growth and the durability of the AI-driven investment cycle. However, January is shaping up to be a month where narrative risk matters as much as fundamentals. Questions around the sustainability of AI spending, the trajectory of the U.S. economy and the direction of trade policy could trigger sharper asset rotations.
Monetary policy looms as the central swing factor with the Fed still divided. Most market participants expect rates to stay untouched at the January meeting but show far less consensus for March. Compounding uncertainty is Trump’s expected appointment of a new Fed chair this month, a development that could significantly change expectations around inflation tolerance and the pace of future easing. In the meantime, equities are likely to grind higher but with rising dispersion across sectors.
Technical Forecast
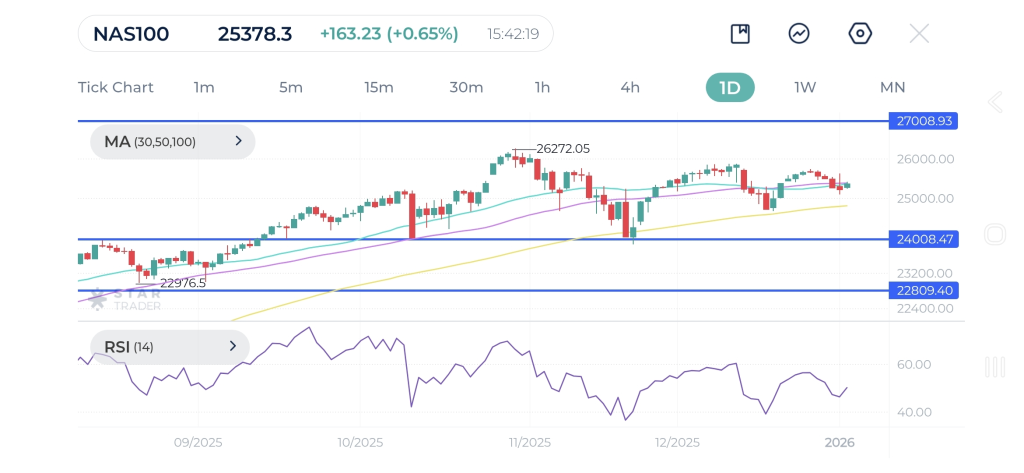
For Nasdaq 100, the upside bias remains compelling despite choppy waters in the past two months. Nevertheless, a bearish RSI divergence raises concerns that the rally might have overextended since its trough in April 2025. As such, the bulls may need some extra breathing room to justify chasing fresh highs. Short-term focus is on pullbacks before a continuation signal would show up. Last November’s low of 24000 is the area of interest as its breach could trigger a deep sell-off and break the current consolidation pattern.
A subdued RSI may attract traders looking to buy the dip. A solid rise above the peak of 26280 would bring in momentum buyers and carry the index into new highs. A shift back to a bullish structure would expose 27000 as the next target.
Oil
Fundamental Outlook
Oil markets moved lower as a fresh geopolitical twist shifted investor focus back toward supply risks. Prices fell after news that the U.S. had captured Venezuelan president Nicolás Maduro and Trump pledged to unlock the country’s vast oil reserves, reviving expectations that additional barrels could eventually flow into an already well-supplied market. While Venezuela currently contributes only about 1% of global output after years of sanctions, underinvestment and infrastructure decay, its possession of the world’s largest proven crude reserves makes any credible reintegration a meaningful medium-term bearish signal.
The immediate price reaction reflects concern that the intervention could deepen the global glut that has weighed for months. Although major U.S. oil companies have yet to publicly commit capital, reports that a former Chevron executive is already seeking $2bn to invest in Venezuelan projects suggest that private capital may move faster than markets had assumed. Even if production gains take time, expectations alone are enough to pressure prices in the near term.
At the same time, escalating rhetoric around Iran introduces a counterbalancing risk premium. Trump’s warnings about a potential strike amid protests raise the prospect of broader Middle East instability, which historically supports crude prices. Looking forward, prices are likely to remain range-bound but biased lower as the balance of risks still favors volatility rather than a sustained rebound.
Technical Forecast
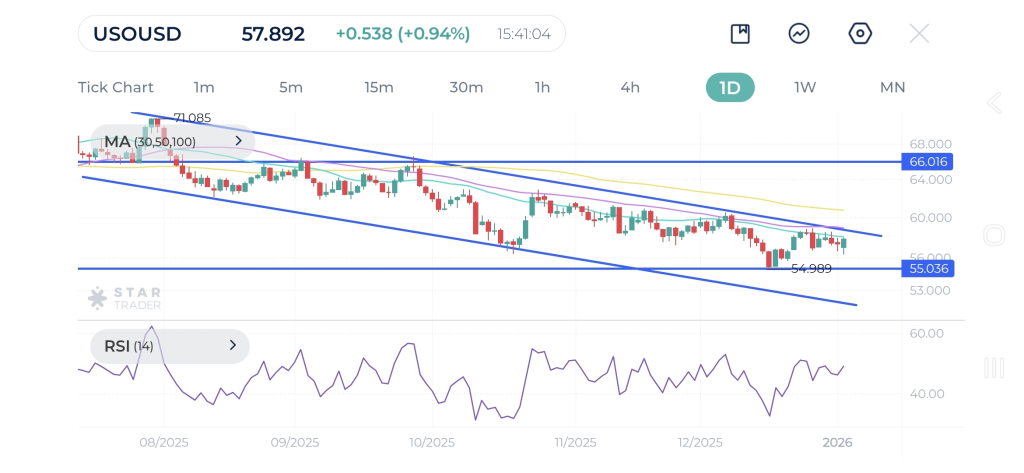
WTI crude has been trading within a downward-sloping channel since June 2025, nested within a broader downtrend in place since September 2023. This structure reinforces the prevailing bearish bias. The bulls have several key hurdles to lift before they could break the pessimistic momentum and hope for a more supportive outlook. 62.00 from a previous botched bounce is the immediate obstacle to remove. Then only a move above 65.50 would force the short side to cover and mark a potential bullish reversal.
Further weakness would bring the price below 55.00 on the lower band of said channel, signaling a bearish continuation and shifting focus to 52.00 from the January 2021 pause, then the psychological level of 50.00, a risky long-term buy-the-dip opportunity.
Key Dates
Friday, Jan 02
Non Farm Payrolls
ISM Manufacturing PMI
Monday, Jan 05
ISM Services PMI
Thursday, Jan 08
EU Unemployment Rate
Friday, Jan 09
Canada Unemployment Rate
Tuesday, Jan 13
U.S. CPI
Thursday, Jan 15
UK GDP
Monday, Jan 19
EU CPI
Tuesday, Jan 20
UK Unemployment Rate
Wednesday, Jan 21
UK CPI
Canada CPI
Thursday, Jan 22
Australia Unemployment Rate
Friday, Jan 23
BoJ Interest Rate Decision
Wednesday, Jan 28
RBA Trimmed Mean CPI
BoC Interest Rate Decision
Fed Interest Rate Decision
Thursday, Jan 29
U.S. GDP
U.S. Core PCE
Tags


Open Live Account
 Email Address
 Phone Number
Important Notice
STARTRADER does not accept any applications from Australian residents.
To comply with regulatory requirements, clicking the button will redirect you to the STARTRADER website operated by STARTRADER PRIME GLOBAL PTY LTD (ABN 65 156 005 668), an authorized Australian Financial Services Licence holder (AFSL no. 421210) regulated by the Australian Securities and Investments Commission.
Important Notice for Residents of the United Arab Emirates
In alignment with local regulatory requirements, individuals residing in the United Arab Emirates are requested to proceed via our dedicated regional platform at startrader.ae, which is operated by STARTRADER Global Financial Consultation & Financial Analysis L.L.C.. This entity is licensed by the UAE Capital Market Authority (CMA) under License No. 20200000241, and is authorised to introduce financial services and promote financial products in the UAE.
Please click the "Continue" button below to be redirected.


