


 Web Trader MT5













Key themes of the week:
- AI investment optimism increasingly challenged by concerns over cash flow, borrowing, and returns.
- Alphabet’s earnings disappointment triggered renewed pressure on technology stocks.
- Anthropic’s IPO filing put the valuation of frontier AI companies in the spotlight.
- The Fed held rates steady but maintained a cautious approach to inflation.
- US GDP growth surprised to the upside, while inflation remained an important concern.
- Gold fell below $4,000 and silver moved closer to $50.
- Oil remained elevated as geopolitical risks threatened energy infrastructure and supply routes.
- U.S. Stock market continues to break new highs, feuld by trade deal optimism
Global Equities: AI Spending Under Scrutiny
US equities initially gained as investors welcomed Anthropic’s IPO filing and anticipated strong technology earnings. However, sentiment deteriorated toward the end of the week following disappointing results from some of the largest technology companies.
Microsoft reported strong results, supported by 48% growth in Azure revenue, demonstrating continued demand for cloud and AI services. Its shares initially gained around 3%.
Alphabet delivered a major disappointment, missing earnings and revenue expectations while reporting negative free cash flow of $9.07 billion. Its shares plunged more than 12%, wiping out approximately $500 billion in market value.
Amazon also reported strong AWS growth, with cloud revenue increasing 39%. However, concerns about its substantial capital expenditure and negative free cash flow weighed on investor sentiment.
Meanwhile, Anthropic’s IPO filing marked another significant development for the AI industry. Its potential listing could provide an important valuation benchmark for frontier AI companies and attract further attention to the economics of developing advanced AI models.
Market implication: Investors are becoming more selective about AI-related stocks. Strong revenue growth is no longer sufficient, markets increasingly demand evidence that massive infrastructure investments will generate sustainable profits and cash flow.
Federal Reserve: Rates Unchanged, Inflation Remains a Concern
The Federal Reserve maintained interest rates at 3.75%–4% at its October meeting, as widely expected. However, the decision was divided, with a 10–2 vote, as two policymakers preferred a 25-basis-point increase.
Chair Kevin Warsh emphasized that inflation remains a concern, leaving the door open to further tightening depending on incoming economic data.
US Q3 GDP expanded at an annualized rate of 3.4%, demonstrating continued economic resilience. Meanwhile, September PCE inflation showed persistent price pressures, with headline inflation reaching 3.6% annually and core PCE standing at 3.1%.
The combination of strong economic growth and persistent inflation makes it difficult for the Fed to consider monetary easing. Markets are therefore increasingly focused on the possibility of another rate increase in December.
Commodities: Gold and Silver Fall, Oil Remains Elevated
Gold: Gold fell below the psychological $4,000 level as a stronger US dollar, elevated Treasury yields, and expectations of further Fed tightening weighed on demand. Despite ongoing geopolitical uncertainty, higher interest rate expectations limited the metal’s safe-haven appeal.
Silver: Silver also extended its decline, approaching the important $50 psychological threshold. Higher real yields and dollar strength continued to pressure the precious metal.
Oil: Oil prices remained elevated, with Brent crude trading above $116 per barrel and WTI above $103. Renewed attacks on Saudi energy infrastructure and concerns surrounding the Strait of Hormuz reinforced fears of potential supply disruptions. Geopolitical developments remain the main driver of short-term price movements.
Outlook for Next Week: 2–6 November 2026
The first week of November will bring several important economic releases, the US midterm elections, and another round of corporate earnings.
Key economic events include US ISM Manufacturing PMI on Monday, the US midterm elections and JOLTS data on Tuesday, ADP employment and ISM Services PMI on Wednesday, and US Nonfarm Payrolls and unemployment data on Friday.
Corporate earnings will also remain in focus, particularly reports from Apple, Palantir, AMD, Arm Holdings, and Qualcomm. Investors will be looking for further evidence of AI-related demand and whether technology companies can translate infrastructure investments into stronger financial performance.
Major Economic Calendar Events for the Upcoming Week
| Date | Metric | Country | Previous | Time [Dubai] |
|---|---|---|---|---|
| Monday, 2 November | ISM Manufacturing PMI | USA | 54.5 | 7:00 PM |
| Tuesday, 3 November | Cash Rate | Australia | 4.60% | 7:30 AM |
| Tuesday, 3 November | JOLTS Job Openings | USA | 7.08M | 7:00 PM |
| Tuesday, 3 November | Congressional Elections | USA | All Day | |
| Wednesday, 4 November | Employment Change q/q | New Zealand | 0.5% | 1:45 AM |
| Wednesday, 4 November | Unemployment Rate | New Zealand | 5.6% | 1:45 AM |
| Wednesday, 4 November | CPI Flash Estimate y/y | Euro | 3.8% | 2:00 PM |
| Wednesday, 4 November | ADP Nonfarm Employment Change | USA | 90K | 5:15 PM |
| Wednesday, 4 November | ISM Services PMI | USA | 54.9 | 7:00 PM |
| Thursday, 5 November | Official Bank Rate | UK | 3.75% | 4:00 PM |
| Thursday, 5 November | Unemployment Claims | USA | 5:30 PM | |
| Friday, 6 November | Employment Change | Canada | -68.3K | 5:30 PM |
| Friday, 6 November | Unemployment Rate | Canada | 6.5% | 5:30 PM |
| Friday, 6 November | Average Hourly Earnings m/m | USA | 0.1% | 5:30 PM |
| Friday, 6 November | Non-Farm Employment Change | USA | 29K | 5:30 PM |
| Friday, 6 November | Unemployment Rate | USA | 4.2% | 5:30 PM |
| Friday, 6 November | Ivey PMI | Canada | 58.2 | 7:00 PM |
Technical Analysis and Forecast:
Silver Technical Analysis
Silver remains under significant selling pressure. The metal has experienced a substantial correction over the past several weeks, with recent price action indicating that sellers continue. The latest session has pushed silver toward $50.42, marking another important test of support. The absence of a meaningful bullish reversal pattern suggests that downside risks remain elevated, particularly as the metal continues to establish lower highs and lower lows.
The moving averages confirm the strength of the bearish trend. Silver is trading significantly below all three averages, the 5-day, 10-day, and 20-day averages, which remain aligned in a bearish configuration.
Immediate support is located around $50.42, followed by the psychological $50.00 level and then $48.51. A decisive break below $50.42 could accelerate the decline toward $48.51. On the upside, initial resistance lies around $53.03, followed by $54.66 and $56.96. A recovery above $54.66 would indicate improving momentum, while a sustained move above $56.96 would be required to significantly weaken the prevailing bearish structure. The short-term outlook remains strongly bearish, with the $50.00 psychological level becoming particularly important.
Silver Daily Chart
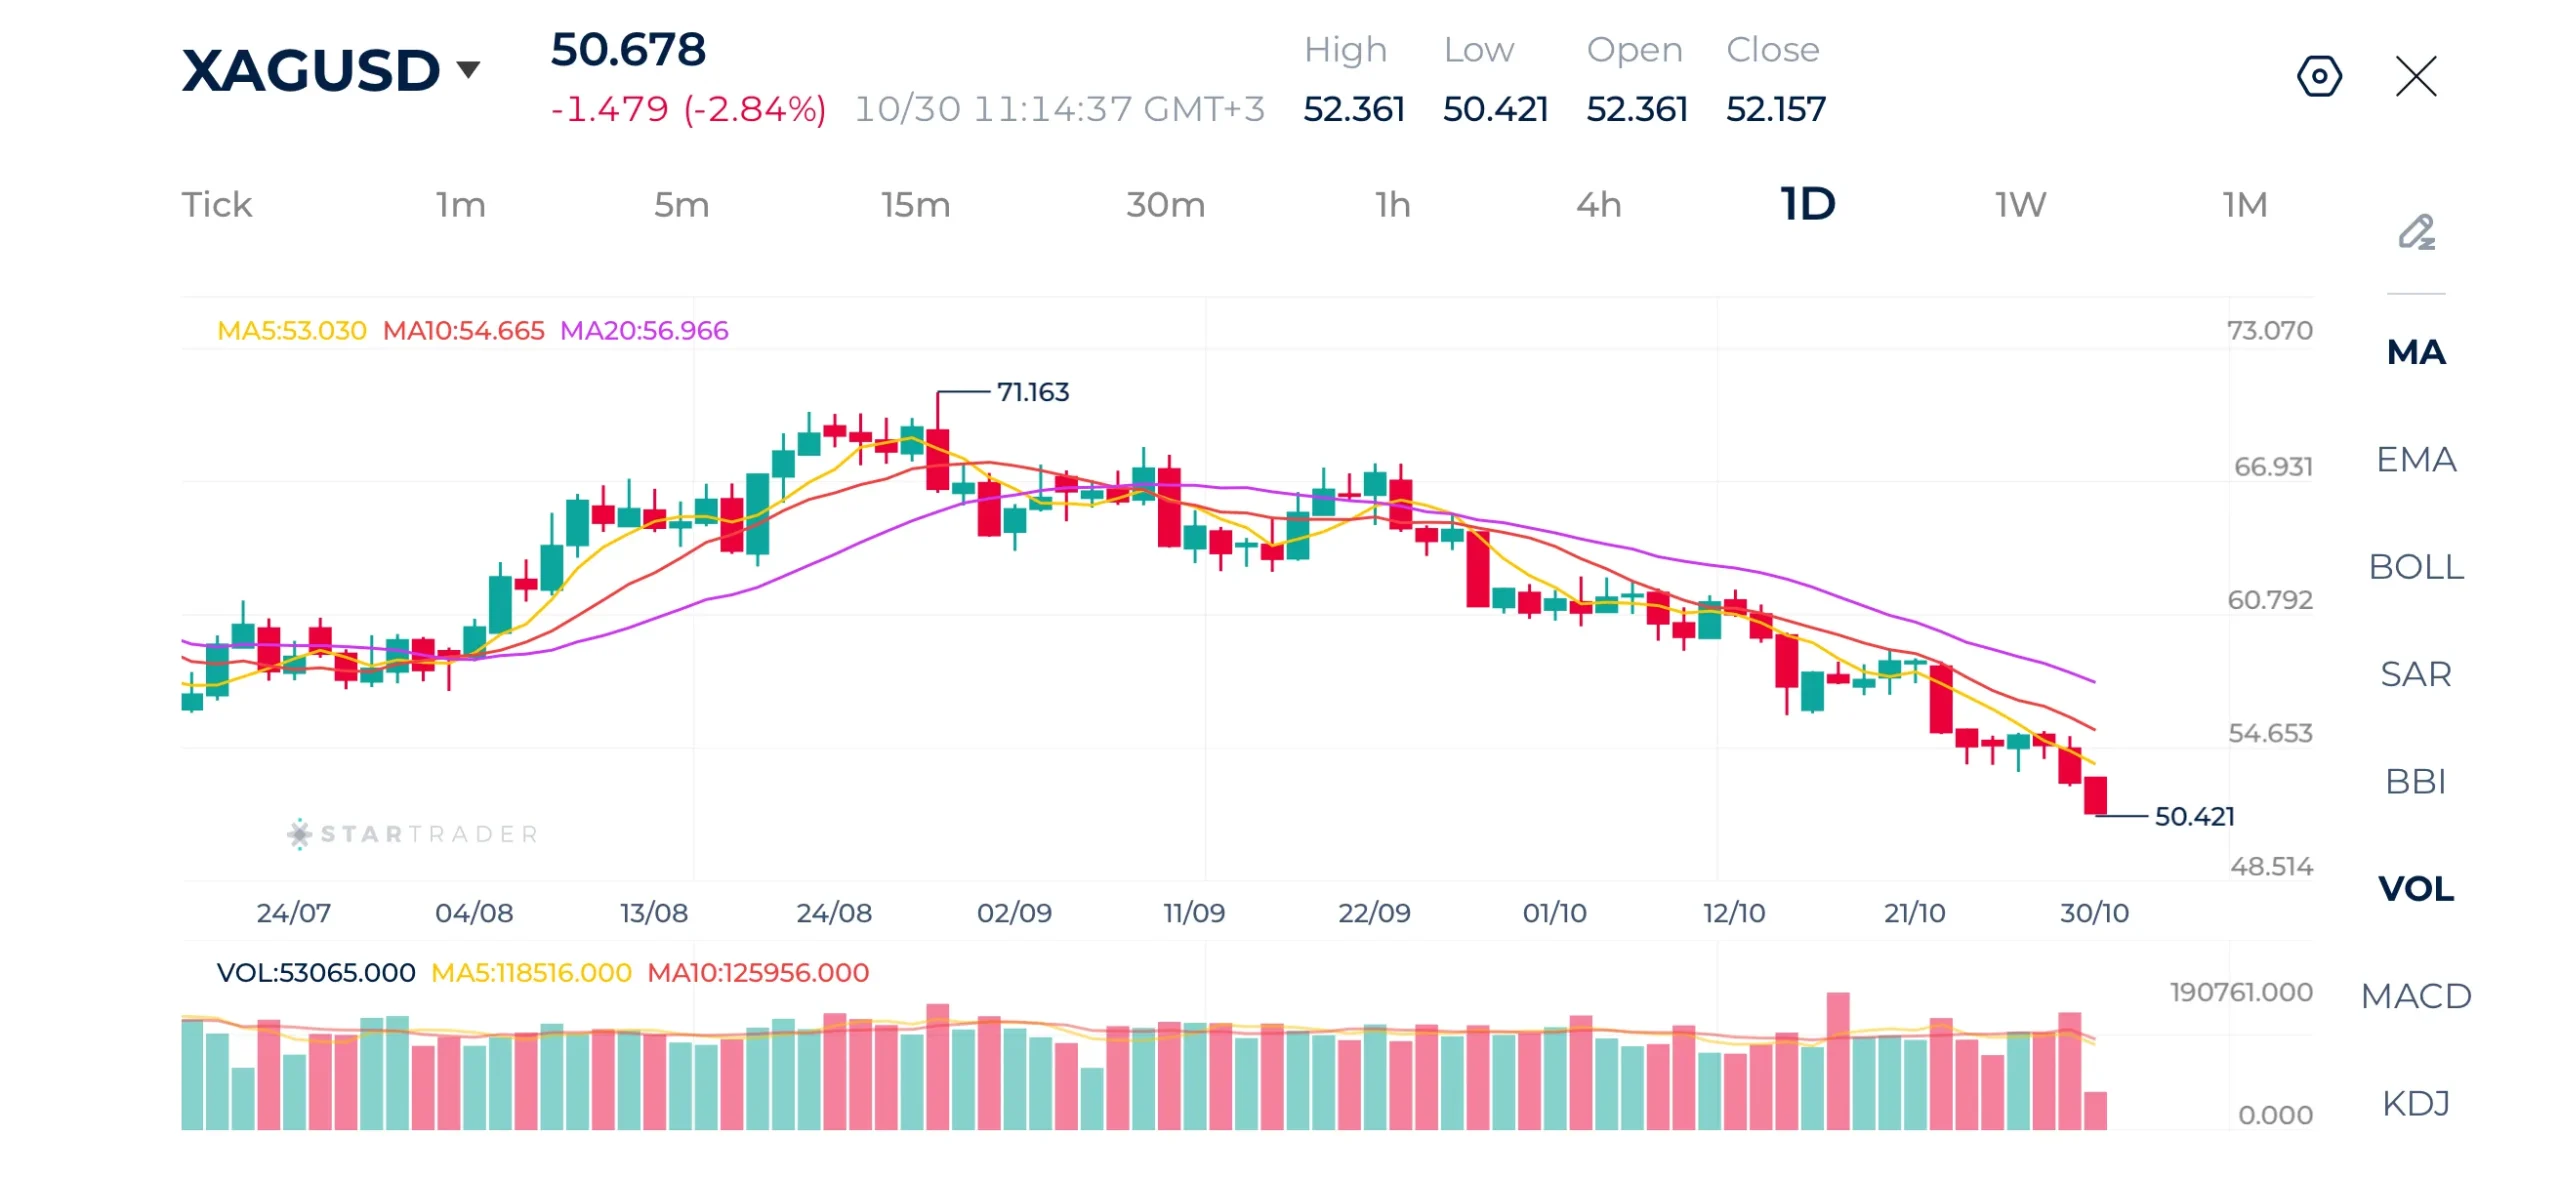
Source: STARTRADER app | Silver prices plummet to the $50 psychological level
| Resistance | $52.81 – $53.00 | $54.55 – $54.65 | $56.80 – $56.96 |
|---|---|---|---|
| Support | $49.82 – $50.00 | $48.50 – $48.54 | $46.22 – $46.30 |
Brent Technical Analysis
Brent crude continues to demonstrate strong bullish momentum, extending its upward trajectory. The latest price action shows the market approaching its recent high of $118.56, supported by a consistent sequence of higher highs and higher lows. Brent’s broader technical structure remains firmly bullish, with buyers maintaining control despite occasional periods of consolidation. The latest candles suggest that the upward momentum remains intact, although the market is approaching an important resistance area.
The moving averages strongly support the bullish outlook. Price is trading comfortably above the 5-day, 10-day, and 20-day averages, which are aligned in a bullish configuration.
Immediate resistance is located around $118.56, the recent high, followed by the $120.00 psychological level and the $122.38 area. A sustained breakout above $118.569 could open the door toward $120.00 and potentially $122.38. On the downside, initial support lies around $115.81, followed by $114.31 and $111.09. A sustained break below $111.09 would significantly weaken the current structure. The short-term outlook remains bullish, with a breakout above $118.56 potentially providing the next upward catalyst.
Brent Daily Chart
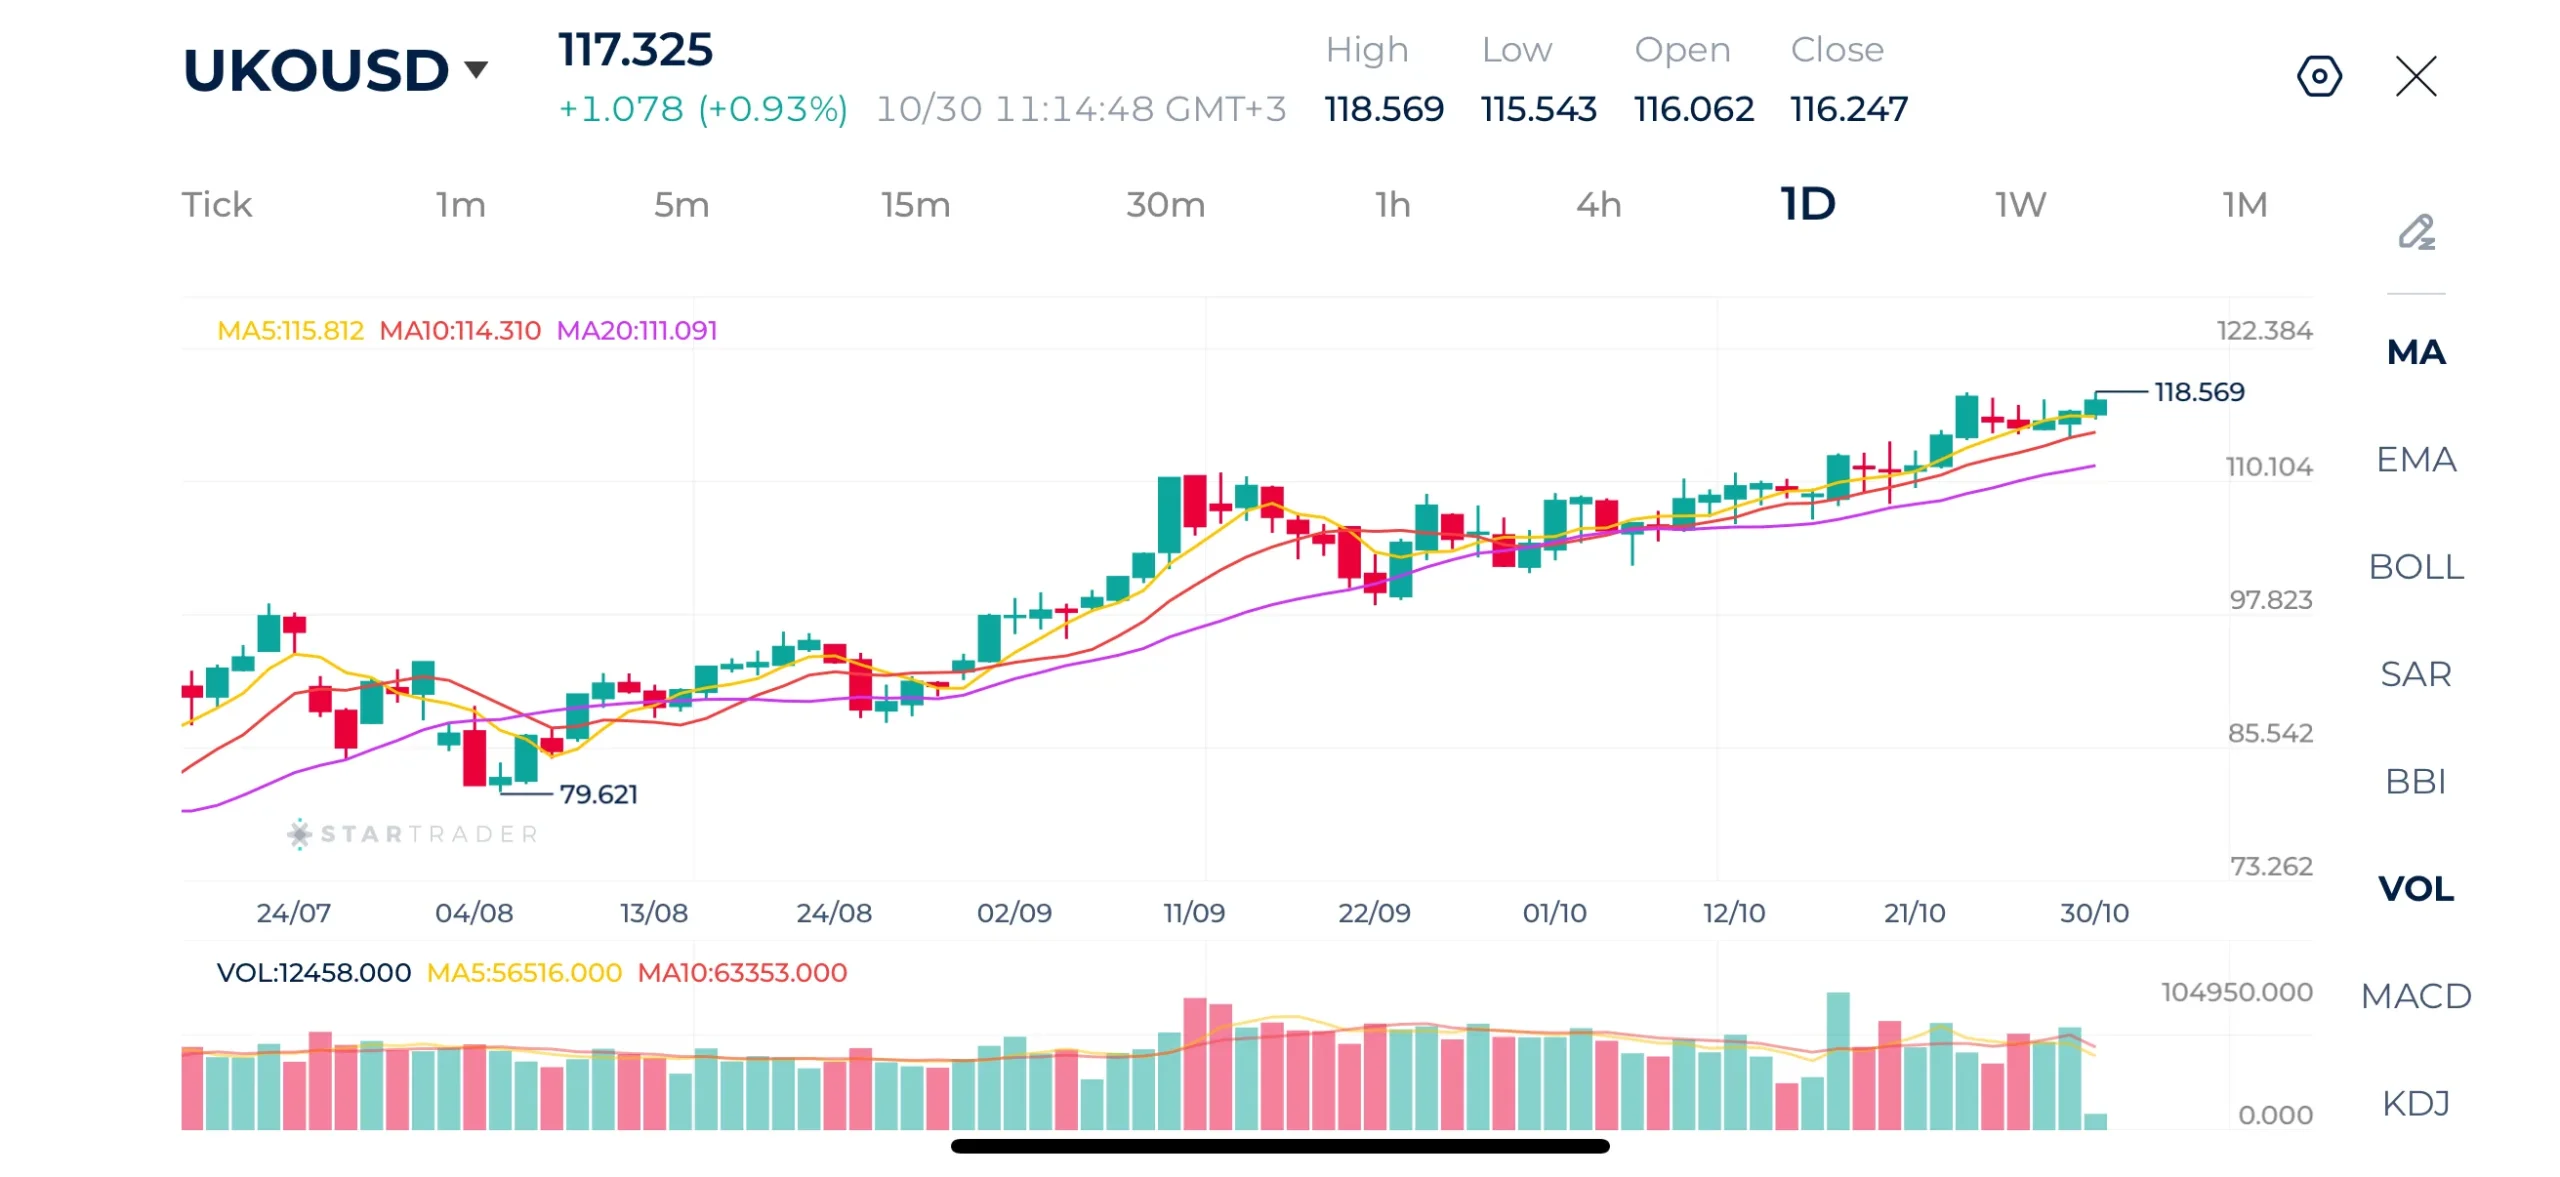
Source: STARTRADER app | Crude brent exhibits bullish momentum as it nears $120 level
| Resistance | $119.00 – $119.20 | $120.00 – $120.14 | $120.88 – $121.00 |
|---|---|---|---|
| Support | $117.21 – $117.30 | $116.12 – $116.20 | $115.81 – $116.00 |
S&P 500 Technical Analysis
The S&P 500 is showing signs of weakening momentum following its failure to sustain the recent rally toward 7,850. The index has entered a consolidation phase, with price action increasingly tilted to the downside. Recent candles indicate repeated difficulty in recovering above the 7,738 area, while the latest session’s decline has pushed the index below its short and medium term moving averages. This suggests that sellers are gaining control, although the broader structure still reflects the consolidation of a previous upward move.
The moving averages reinforce the bearish short term outlook. The index is trading below all three averages MA5, MA10 and MA20. This bearish alignment indicates deteriorating momentum and suggests that recovery attempts may encounter selling pressure around these averages.
Immediate support is located around 7,639, followed by 7,575 and 7,412. A break below 7,575 could accelerate selling pressure toward the 7,412 area. On the upside, initial resistance lies around 7,695–7,700, followed by 7,739. A sustained move above 7,739 would improve the technical picture, while a break above 7,850 would signal a stronger bullish recovery. For now, the short term outlook remains bearish, with particular attention on whether the index can defend the 7,575 support area.
S&P 500 Daily Chart
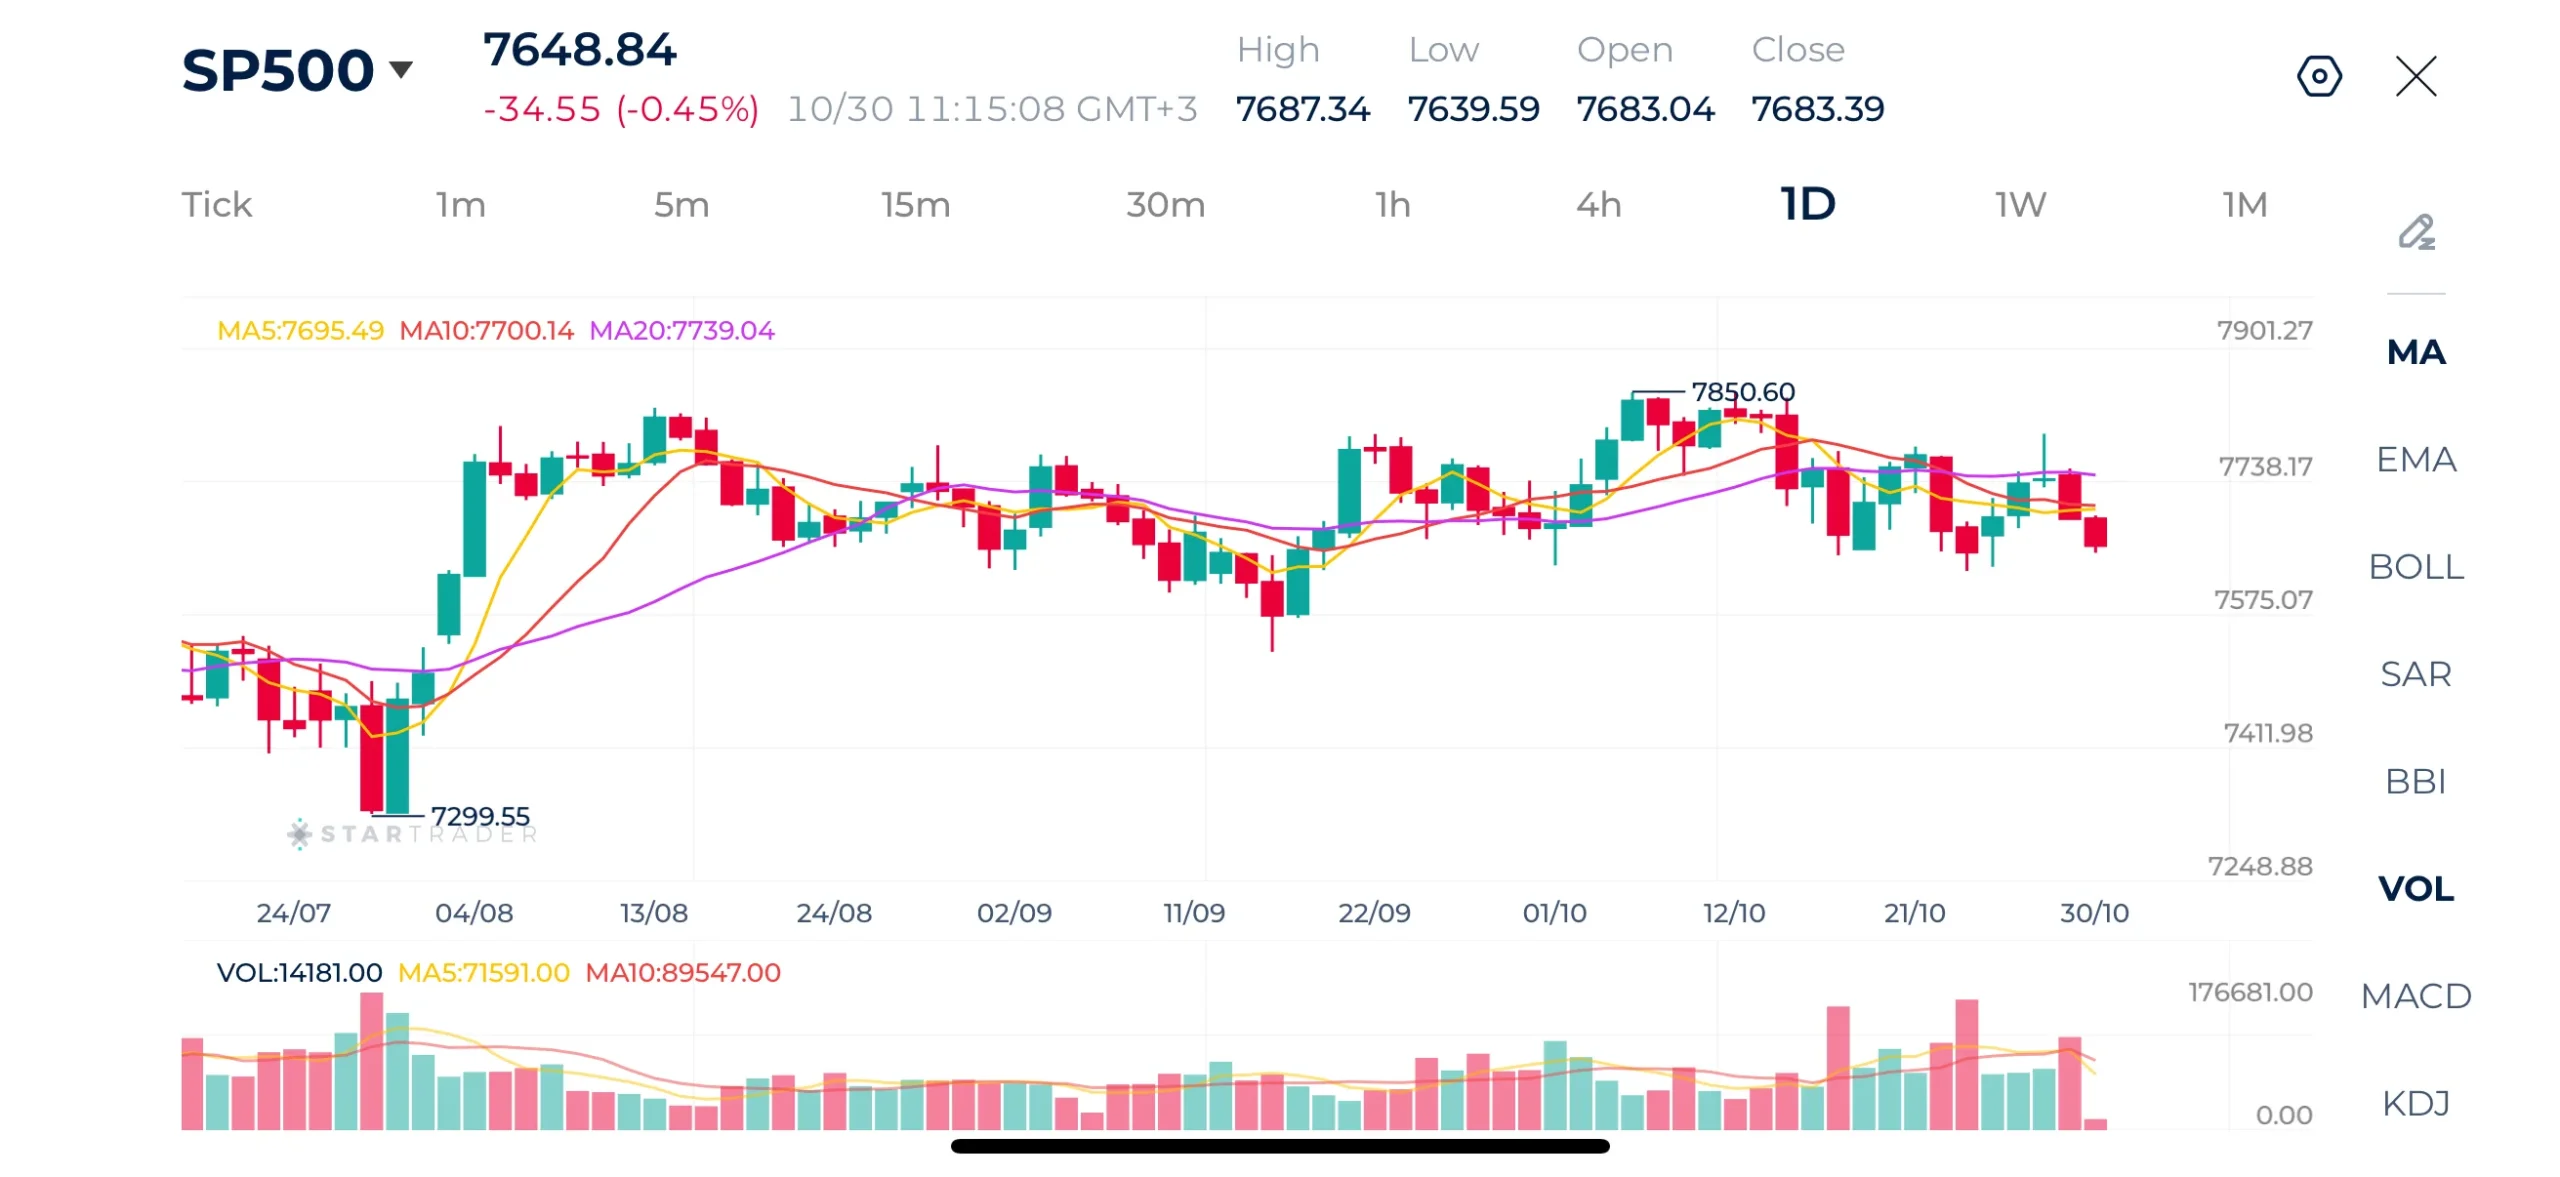
Source: STARTRADER app | S&P 500 remains range-bound near record highs
| Resistance | 7,745 – 7,760 | 7,850 – 7,862 | 7,900 – 7,920 |
|---|---|---|---|
| Support | 7,575 – 7,580 | 7,446 – 7,457 | 7,300 – 7,321 |
EURUSD Technical Analysis
EUR/USD is showing early signs of stabilization following its prolonged decline from the August high of 1.1710. The pair recently established a low around 1.1104 before attempting a recovery, with the latest price action indicating some improvement in buying interest. However, the broader technical structure remains bearish, as the pair has experienced a sustained sequence of lower highs and lower lows over recent weeks.
The moving averages suggest that bearish momentum is gradually easing. This suggests that short-term momentum is improving, although the pair still needs to overcome the 20-day moving average to strengthen the recovery scenario.
Immediate support is located around 1.1170, followed by the recent low at 1.1104. A break below 1.1104 could expose the 1.1048 area. On the upside, initial resistance lies around 1.1198–1.1230, followed by 1.1407. A sustained move above 1.1230 would strengthen the recovery outlook and potentially open the way toward higher resistance levels. The short-term outlook is neutral to cautiously bullish, although the broader trend remains bearish until the pair establishes a sustained move above its moving averages and subsequent resistance levels.
EURUSD Daily Chart
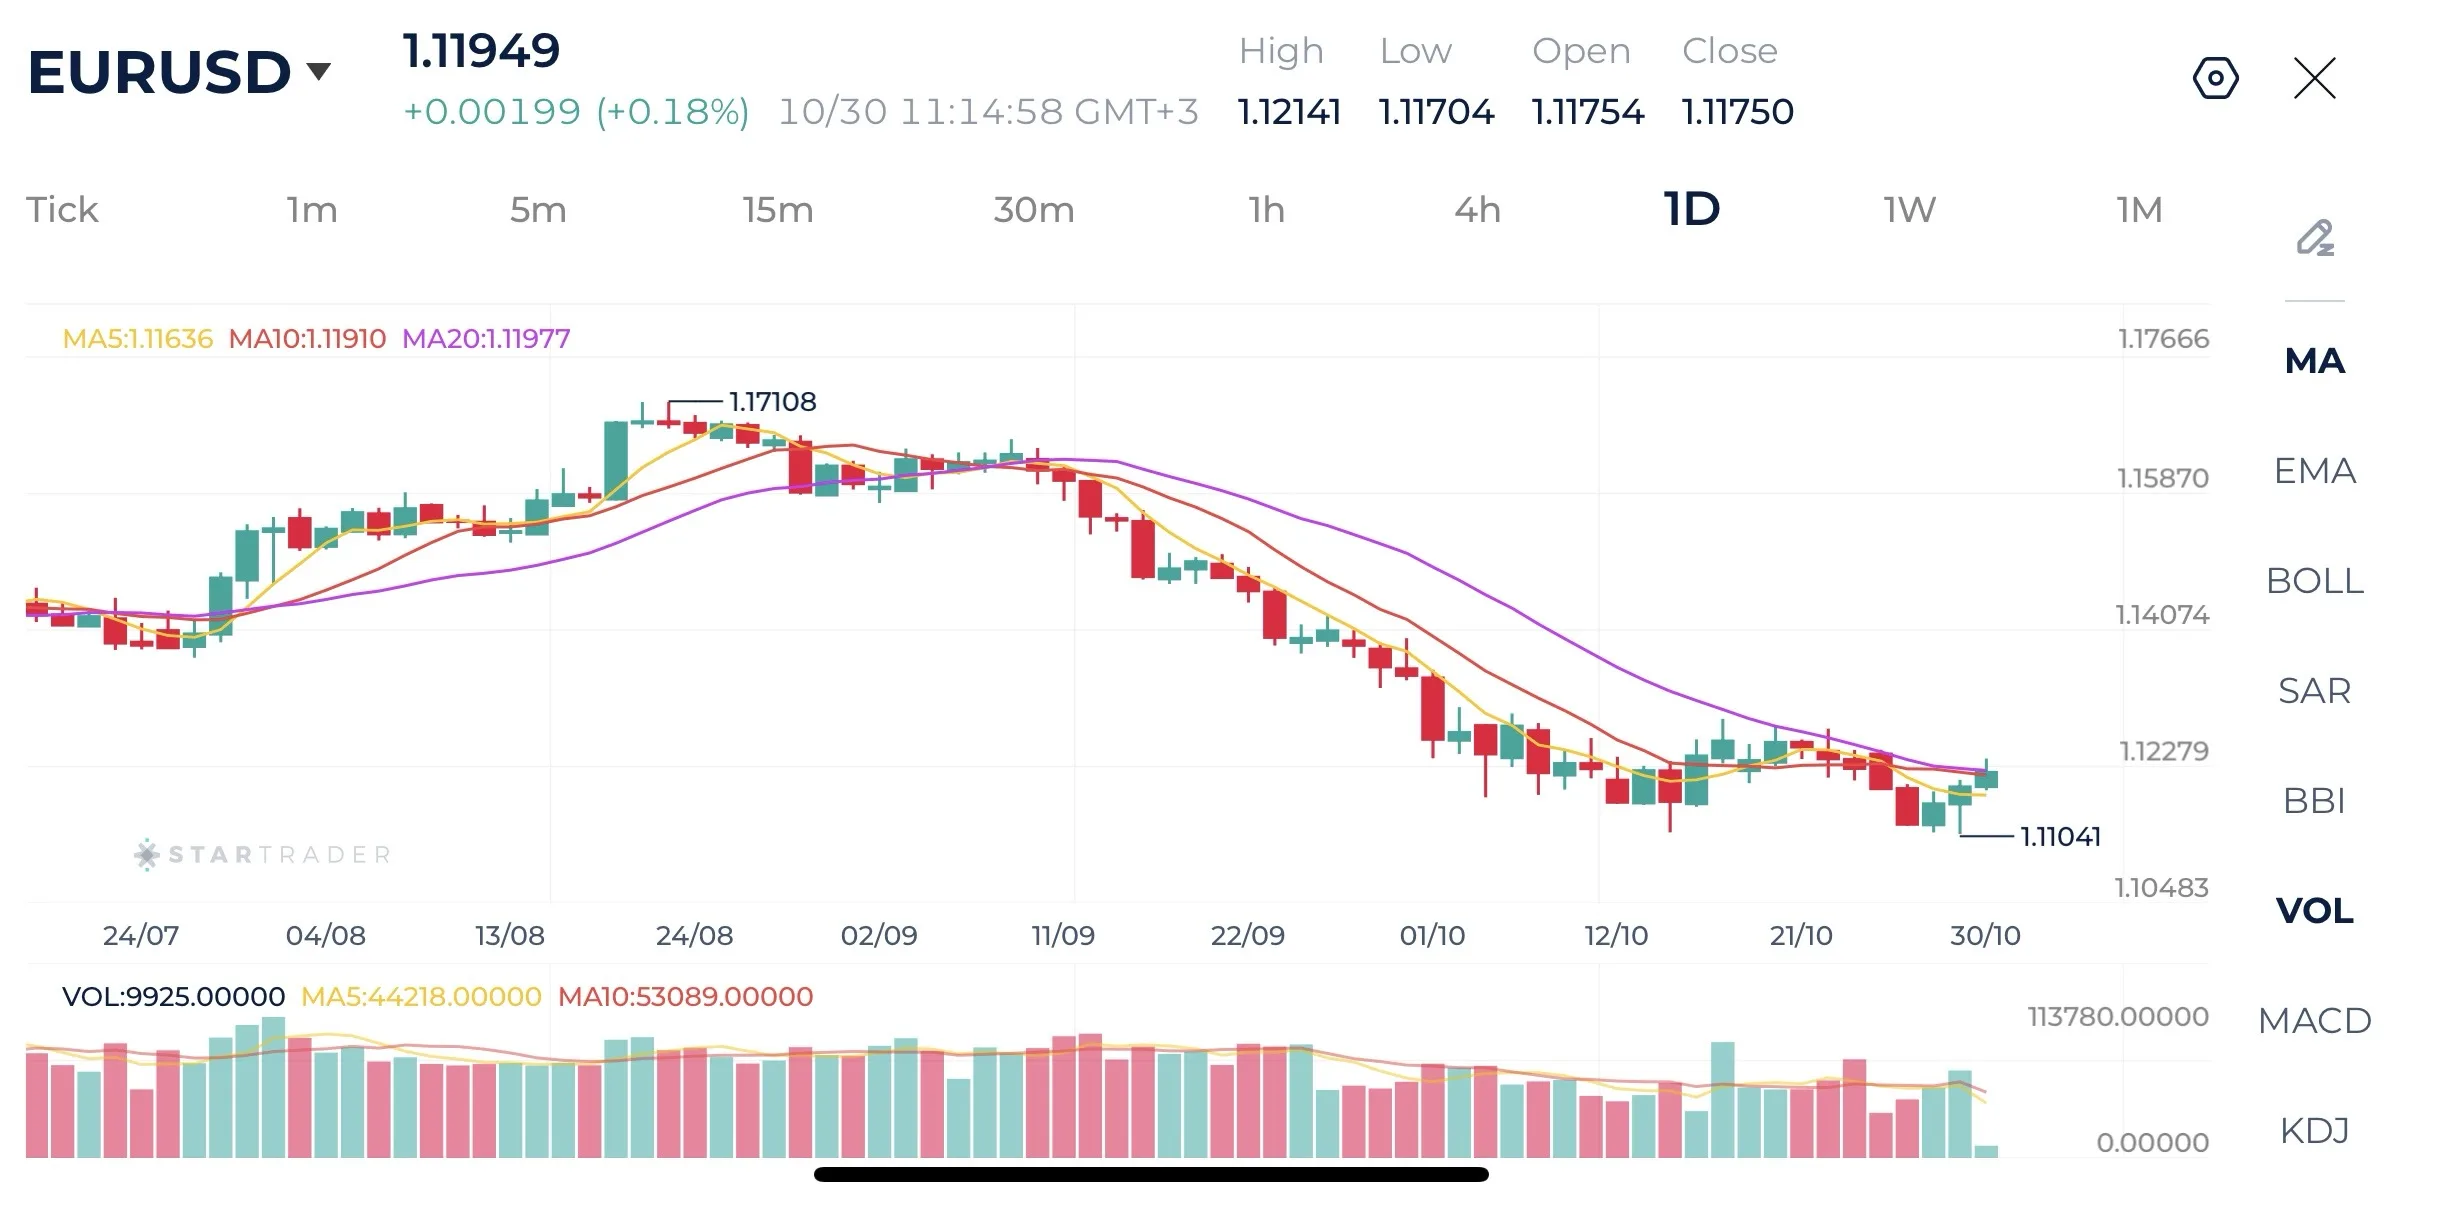
Source: STARTRADER app | EURUSD finds support around the 1.1100 psychological level
| Resistance | 1.1267 – 1.1280 | 1.1354 – 1.1360 | 1.1400 – 1.1407 |
|---|---|---|---|
| Support | 1.1100 – 1.1107 | 1.1066 – 1.1075 | 1.1020 – 1.1025 |
Risk Disclaimer: This material is provided for informational purposes only and does not constitute a recommendation or investment advice. Trading financial instruments on margin involves substantial risk and may not be appropriate for all investors.
Tags


Open Live Account
 Email Address
 Phone Number
Important Notice
STARTRADER does not accept any applications from Australian residents.
To comply with regulatory requirements, clicking the button will redirect you to the STARTRADER website operated by STARTRADER PRIME GLOBAL PTY LTD (ABN 65 156 005 668), an authorized Australian Financial Services Licence holder (AFSL no. 421210) regulated by the Australian Securities and Investments Commission.
Important Notice for Residents of the United Arab Emirates
In alignment with local regulatory requirements, individuals residing in the United Arab Emirates are requested to proceed via our dedicated regional platform at startrader.ae, which is operated by STARTRADER Global Financial Consultation & Financial Analysis L.L.C.. This entity is licensed by the UAE Capital Market Authority (CMA) under License No. 20200000241, and is authorised to introduce financial services and promote financial products in the UAE.
Please click the "Continue" button below to be redirected.


