








 Web Trader MT5








Key Takeaways
- Nasdaq hits record high: Falling oil prices and strong AI-related stocks pushed the Nasdaq to a new record, while the S&P 500 also gained.
- Dow underperforms: The Dow remained under pressure as rising borrowing costs and concerns over inflation weighed on more rate-sensitive sectors.
- Treasury yields surge: The 10-year yield climbed to around 5.20%, its highest level since 2007, increasing pressure on equities and other risk assets.
- Gold remains under pressure: A stronger DXY and rising Treasury yields weighed on gold, pushing prices toward the $4,250 area.
- Bitcoin retreats after strong start: Bitcoin reached its highest level since January near $85,200 before retreating as rising yields reduced risk appetite, despite strong ETF inflows.
- Oil provides some relief: Declining crude prices eased inflation concerns and supported equities, but renewed Middle East tensions remain a key upside risk for oil.
- Next week is data-heavy: US GDP, PCE inflation and NFP will be crucial in shaping expectations for another Fed hike and determining the direction of yields, DXY, gold, equities and crypto.
AI Drives Nasdaq to Record High
US stocks started the week strongly as falling oil prices and lower Treasury yields eased some of the pressure on equity valuations, while renewed demand for AI-related stocks drove a powerful rally. On Monday, the Nasdaq Composite jumped around 2.3% to a new record close, while the S&P 500 gained around 1.5%. Semiconductor stocks were particularly strong, with AMD rising 10% and surpassing a $1 trillion market capitalization, while Intel and Arm also posted double-digit gains.
The rally demonstrated the continued strength of the AI investment theme. However, the performance across the major indices was uneven. The Nasdaq remained the strongest performer, while the S&P 500 also advanced, but the Dow struggled as higher borrowing costs and concerns about inflation continued to weigh on more economically sensitive and rate-sensitive companies.
The major risk for equities remains the bond market. By Thursday, the 10-year Treasury yield reached 5.20%, its highest level since 2007, while the 30-year yield climbed to 5.48%, its highest since 2004.
Falling oil prices and strong AI earnings can support equities, but rising yields can eventually put pressure on valuations, particularly for technology companies whose valuations are more sensitive to discount rates.
Oil Decline Provides Relief to Markets
Oil prices moved lower during the week, providing one of the most important sources of support for equities. Brent and WTI retreated as Saudi crude exports began recovering following earlier disruptions, while expectations of improved supply conditions reduced some of the immediate geopolitical risk premium.
However, the oil market remains highly sensitive to developments in the Middle East. A renewed escalation could quickly push crude higher, reigniting inflation concerns and increasing expectations for additional Fed tightening.
Rising Yields and DXY Create Headwinds for Gold
Gold remained under significant pressure throughout the week as the US dollar strengthened and Treasury yields surged. The Fed’s recent rate hike, combined with strong US economic data, increased expectations that another rate increase could come later this year. By Friday, spot gold had fallen toward $4,250, with higher real yields becoming the dominant short-term driver.
The key issue for gold going forward is therefore likely to remain the relationship between Treasury yields and the dollar. A stabilization or decline in yields could provide relief, while another leg higher in yields could keep gold under pressure.
Bitcoin Reaches Highest Level Since Late January
Bitcoin had a strong start to the week, breaking above $85,200 on Monday, its highest level since January. The move was supported by renewed ETF demand and improved risk sentiment.
However, Bitcoin subsequently retreated as Treasury yields surged above 5%. The relationship highlights Bitcoin’s increasing sensitivity to macro liquidity conditions: strong ETF demand can provide structural support, but higher risk-free yields can encourage investors to reduce exposure to riskier assets.
The failed CLARITY Act vote from the previous week also remains an important backdrop, as the lack of progress toward comprehensive crypto regulation has removed a potential catalyst for institutional adoption.
Outlook for Next Week
- US employment data will be crucial for assessing whether the Fed may raise rates again.
- Treasury yields are becoming the dominant macro driver, with the 10-year reaching its highest level since 2007.
- AI remains the strongest equity theme, but rising yields could increasingly challenge technology valuations.
- Gold remains vulnerable to a stronger DXY and higher real yields, with PCE inflation potentially providing the next major catalyst.
- Bitcoin has strong ETF support, but its ability to sustain the rally will depend heavily on liquidity and Treasury yields.
- Oil remains the key inflation wildcard, further declines would support risk assets, while renewed Middle East disruptions could reignite inflation fears.
- Next week’s GDP, PCE and NFP data could reshape Fed expectations, making the September 30–October 2 period particularly important for the dollar, yields, gold, equities and crypto.
Major Economic Calendar Events for the Upcoming Week
| Date | Metric | Country | Previous | Time [Dubai] |
|---|---|---|---|---|
| Tuesday, 29 September | Interest Rate Decision | Australia | 4.35% | 8:30 AM |
| Tuesday, 29 September | CB Consumer Confidence | USA | 89.4 | 6:00 PM |
| Tuesday, 29 September | JOLTS Job Openings | USA | 7.271M | 6:00 PM |
| Wednesday, 30 September | Consumer Price Index y/y | Australia | 3.5% | 5:30 AM |
| Wednesday, 30 September | Gross Domestic Product q/q | UK | 0.4% | 10:00 AM |
| Wednesday, 30 September | ADP Nonfarm Employment Change | USA | 38K | 4:15 PM |
| Wednesday, 30 September | Core PCE Price Index y/y | USA | 3.3% | 4:30 PM |
| Wednesday, 30 September | Gross Domestic Product q/q | USA | 1.5% | 4:30 PM |
| Thursday, 1 October | Unemployment Claims | USA | 4:30 PM | |
| Thursday, 1 October | ISM Manufacturing PMI | USA | 54.6 | 6:00 PM |
| Friday, 2 October | Consumer Price Index y/y | Euro | 3.2% | 1:00 PM |
| Friday, 2 October | Average Hourly Earnings m/m | USA | 0.3% | 4:30 PM |
| Friday, 2 October | Non-Farm Payrolls | USA | 162K | 4:30 PM |
| Friday, 2 October | Unemployment Rate | USA | 4.1% | 4:30 PM |
Technical Analysis and Forecast:
Gold Technical Analysis
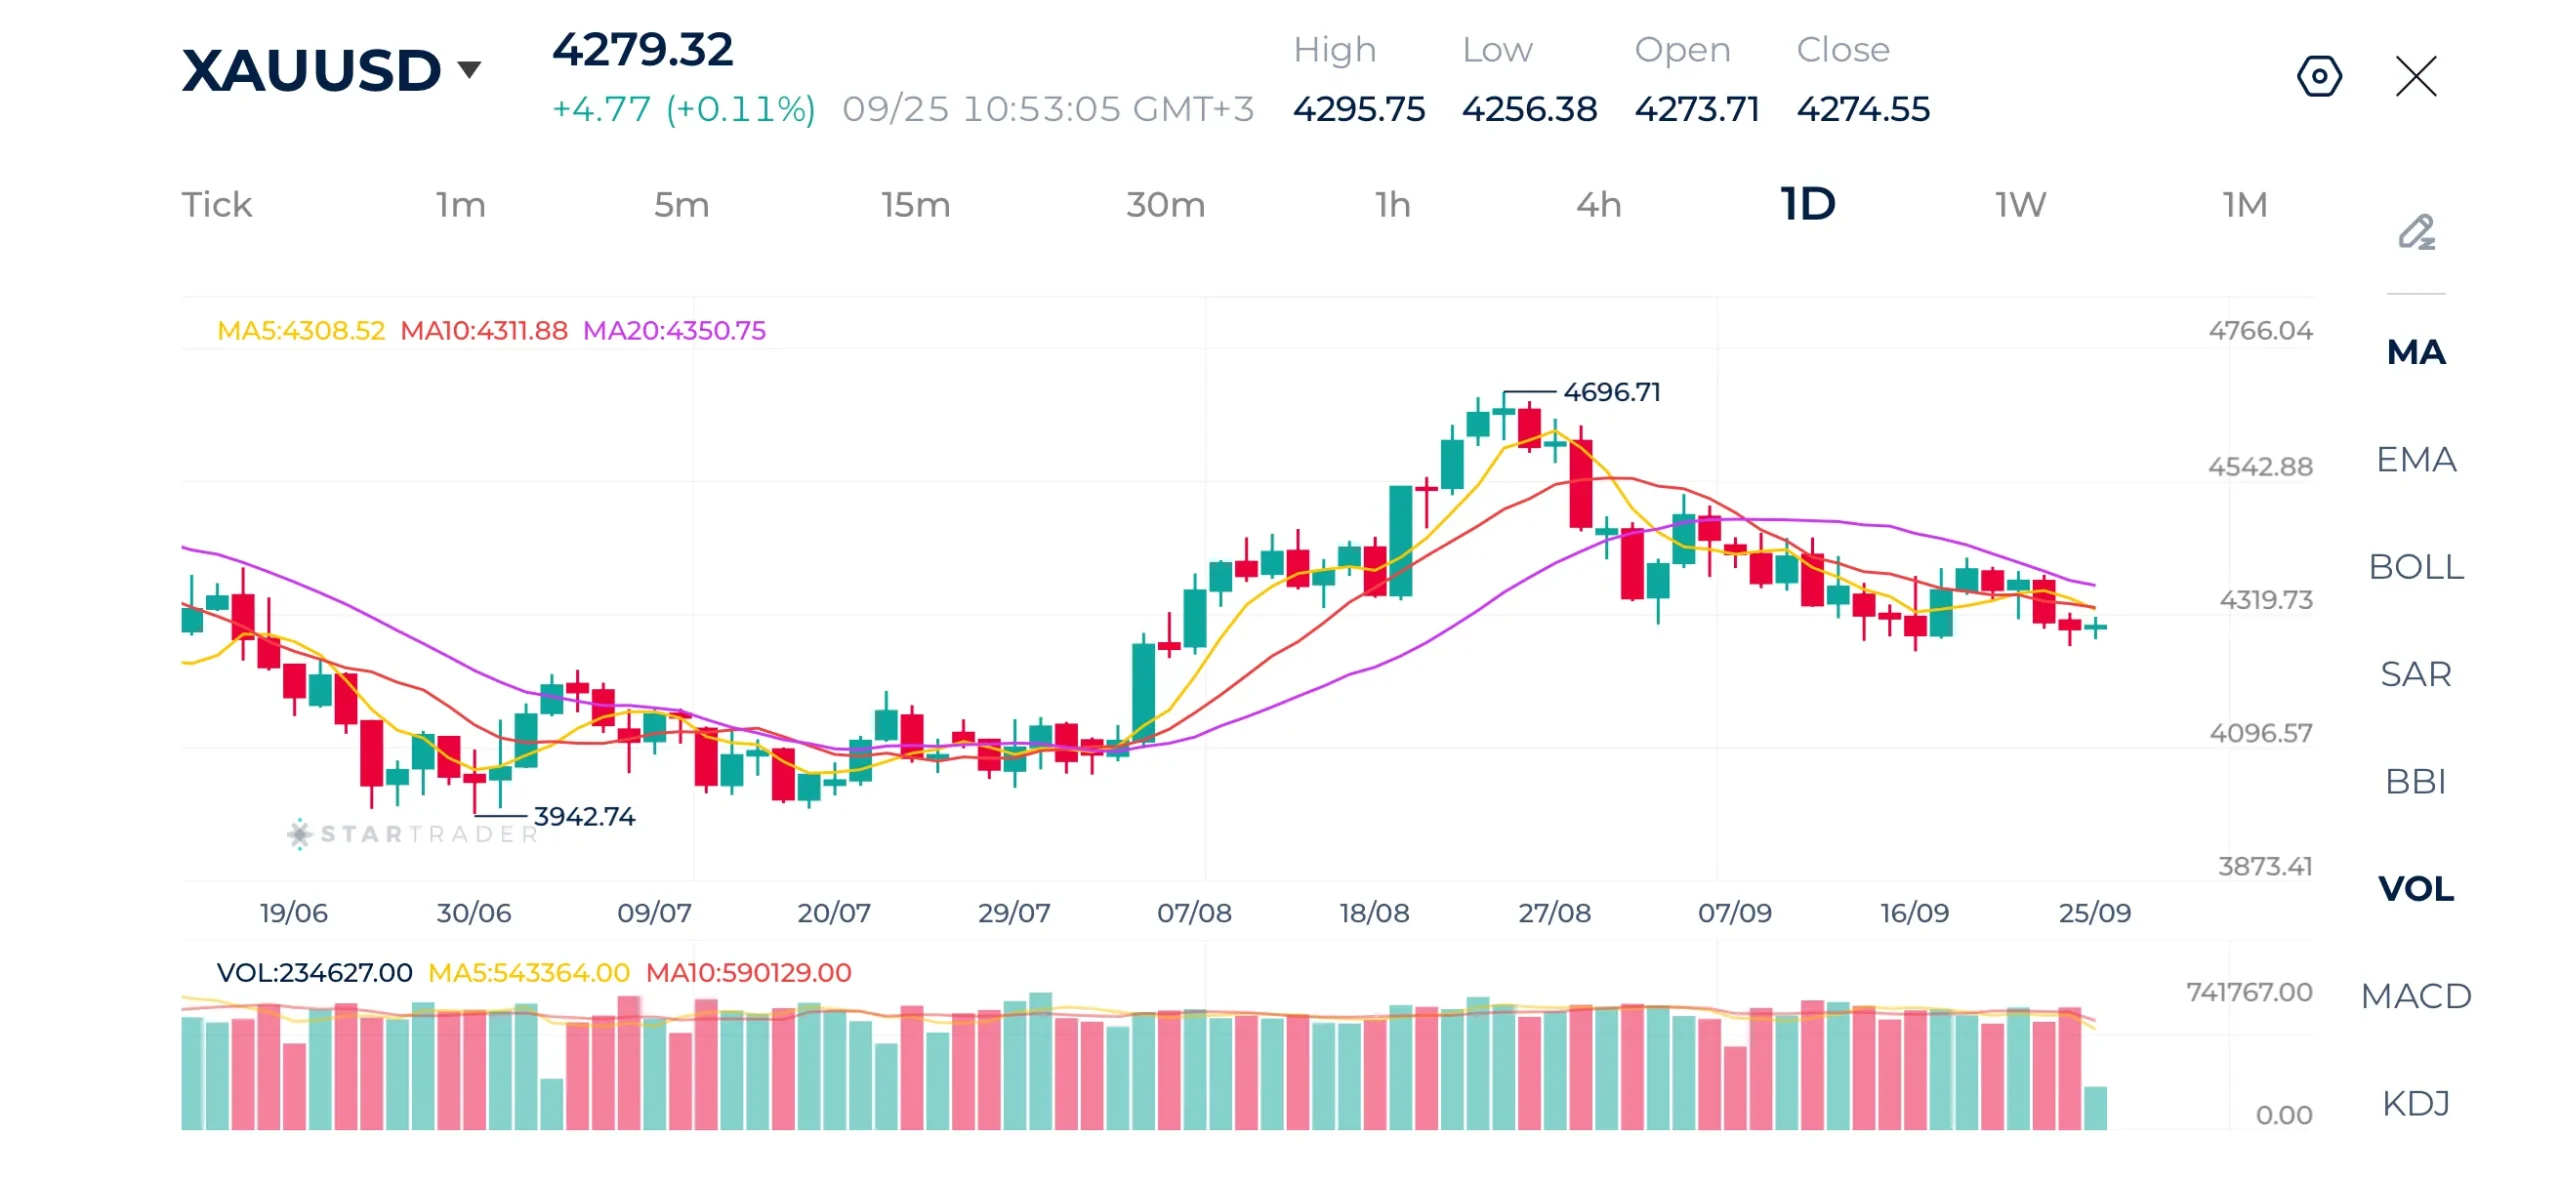
Gold is showing a bearish-to-neutral short-term structure after falling significantly from its record high of $4,696. The precious metal is currently trading around $4,279, below the three moving averages MA5, MA10 and MA20, which indicates that selling pressure remains present.
The immediate support is around $4,250–$4,260, while a break below this zone could expose the $4,100 area. On the upside, resistance is around $4,320, followed by $4,350 and $4,351.
For now, gold needs to reclaim the $4,350 area to improve its short-term technical picture. Until then, the chart points to continued consolidation or downside pressure following the recent correction.
Gold Daily Chart
Source: STARTRADER app | Gold prices fall on rising yields and a stronger dollar
| Resistance | $4,320 – $4,334 | $4,387 – $4,400 | $4,466 – $4,480 |
|---|---|---|---|
| Support | $4,250 – $4,255 | $4,100 – $4,112 | $4,066 – $4,080 |
Brent Technical Analysis
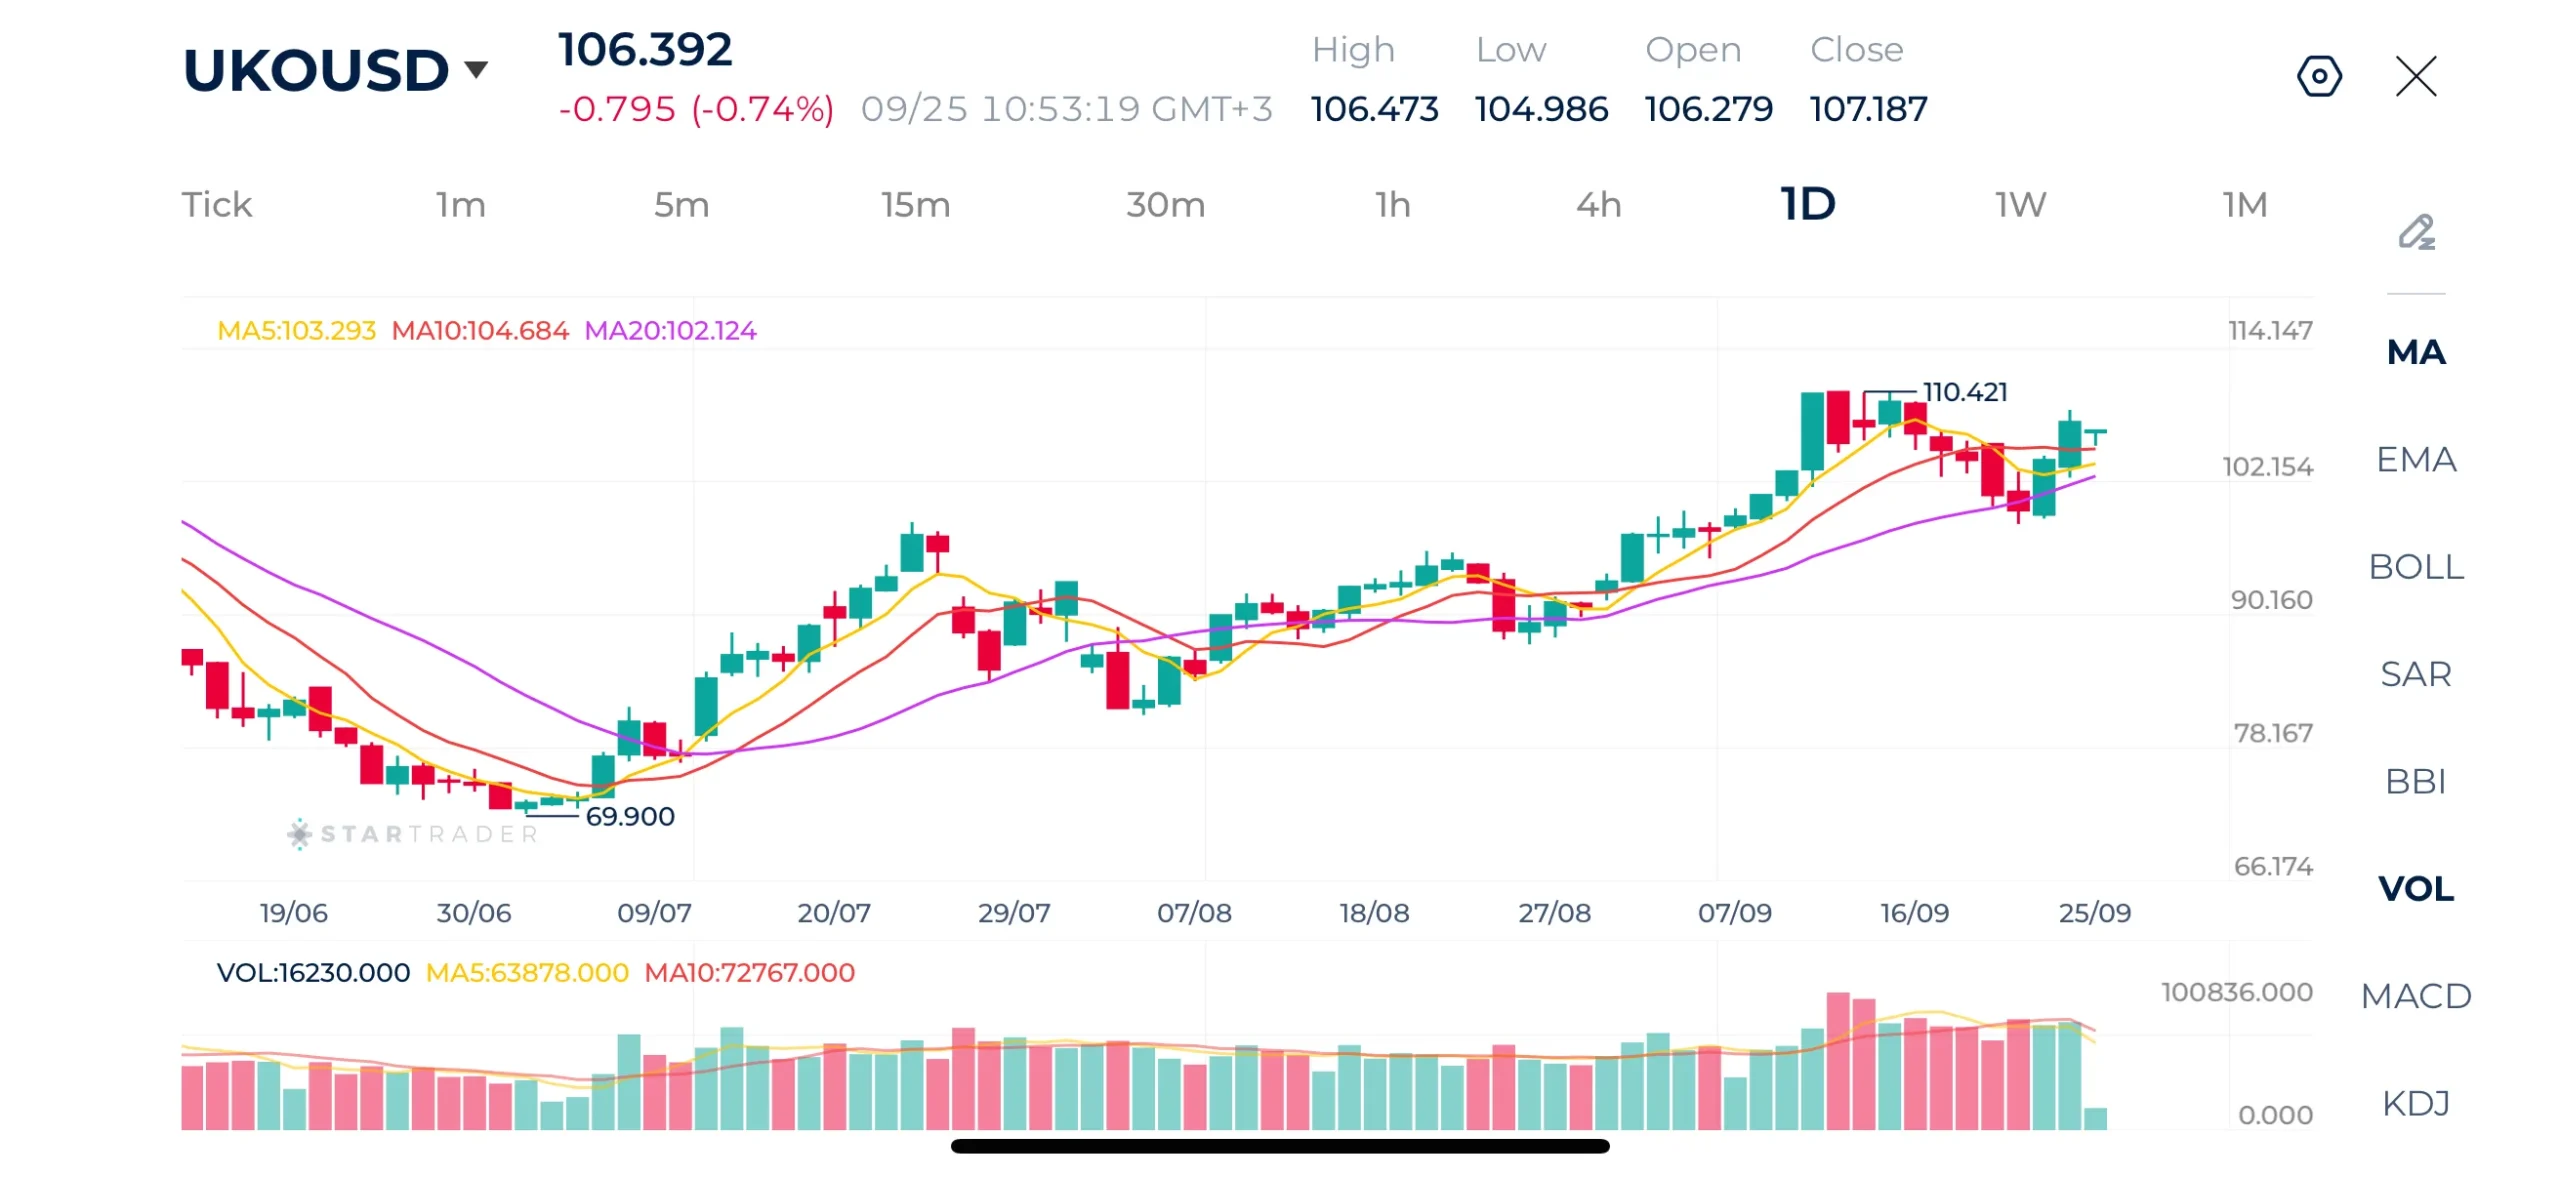
Brent remains in a strong bullish trend on the daily chart despite the recent pullback from the $110.42 high. Price is currently around $106.39, above all three moving averages, while the MA5 and MA10 remain above the MA20.
The recent decline toward the $102 area was followed by a rebound, suggesting buyers remain active. Immediate resistance is around $110.42, while the next support is around $102.15.
A break above $110.42 would reinforce the bullish structure, while a sustained move below $102 could signal a deeper correction.
Brent Daily Chart
Source: STARTRADER app | Oil prices remain elevated despite the recent pullback
| Resistance | $110.42 – $110.50 | $111.67 – $111.80 | $112.88 – $113.00 |
|---|---|---|---|
| Support | $102.15 – $102.23 | $101.34 – $101.40 | $100.21 – $100.34 |
Nasdaq Technical Analysis
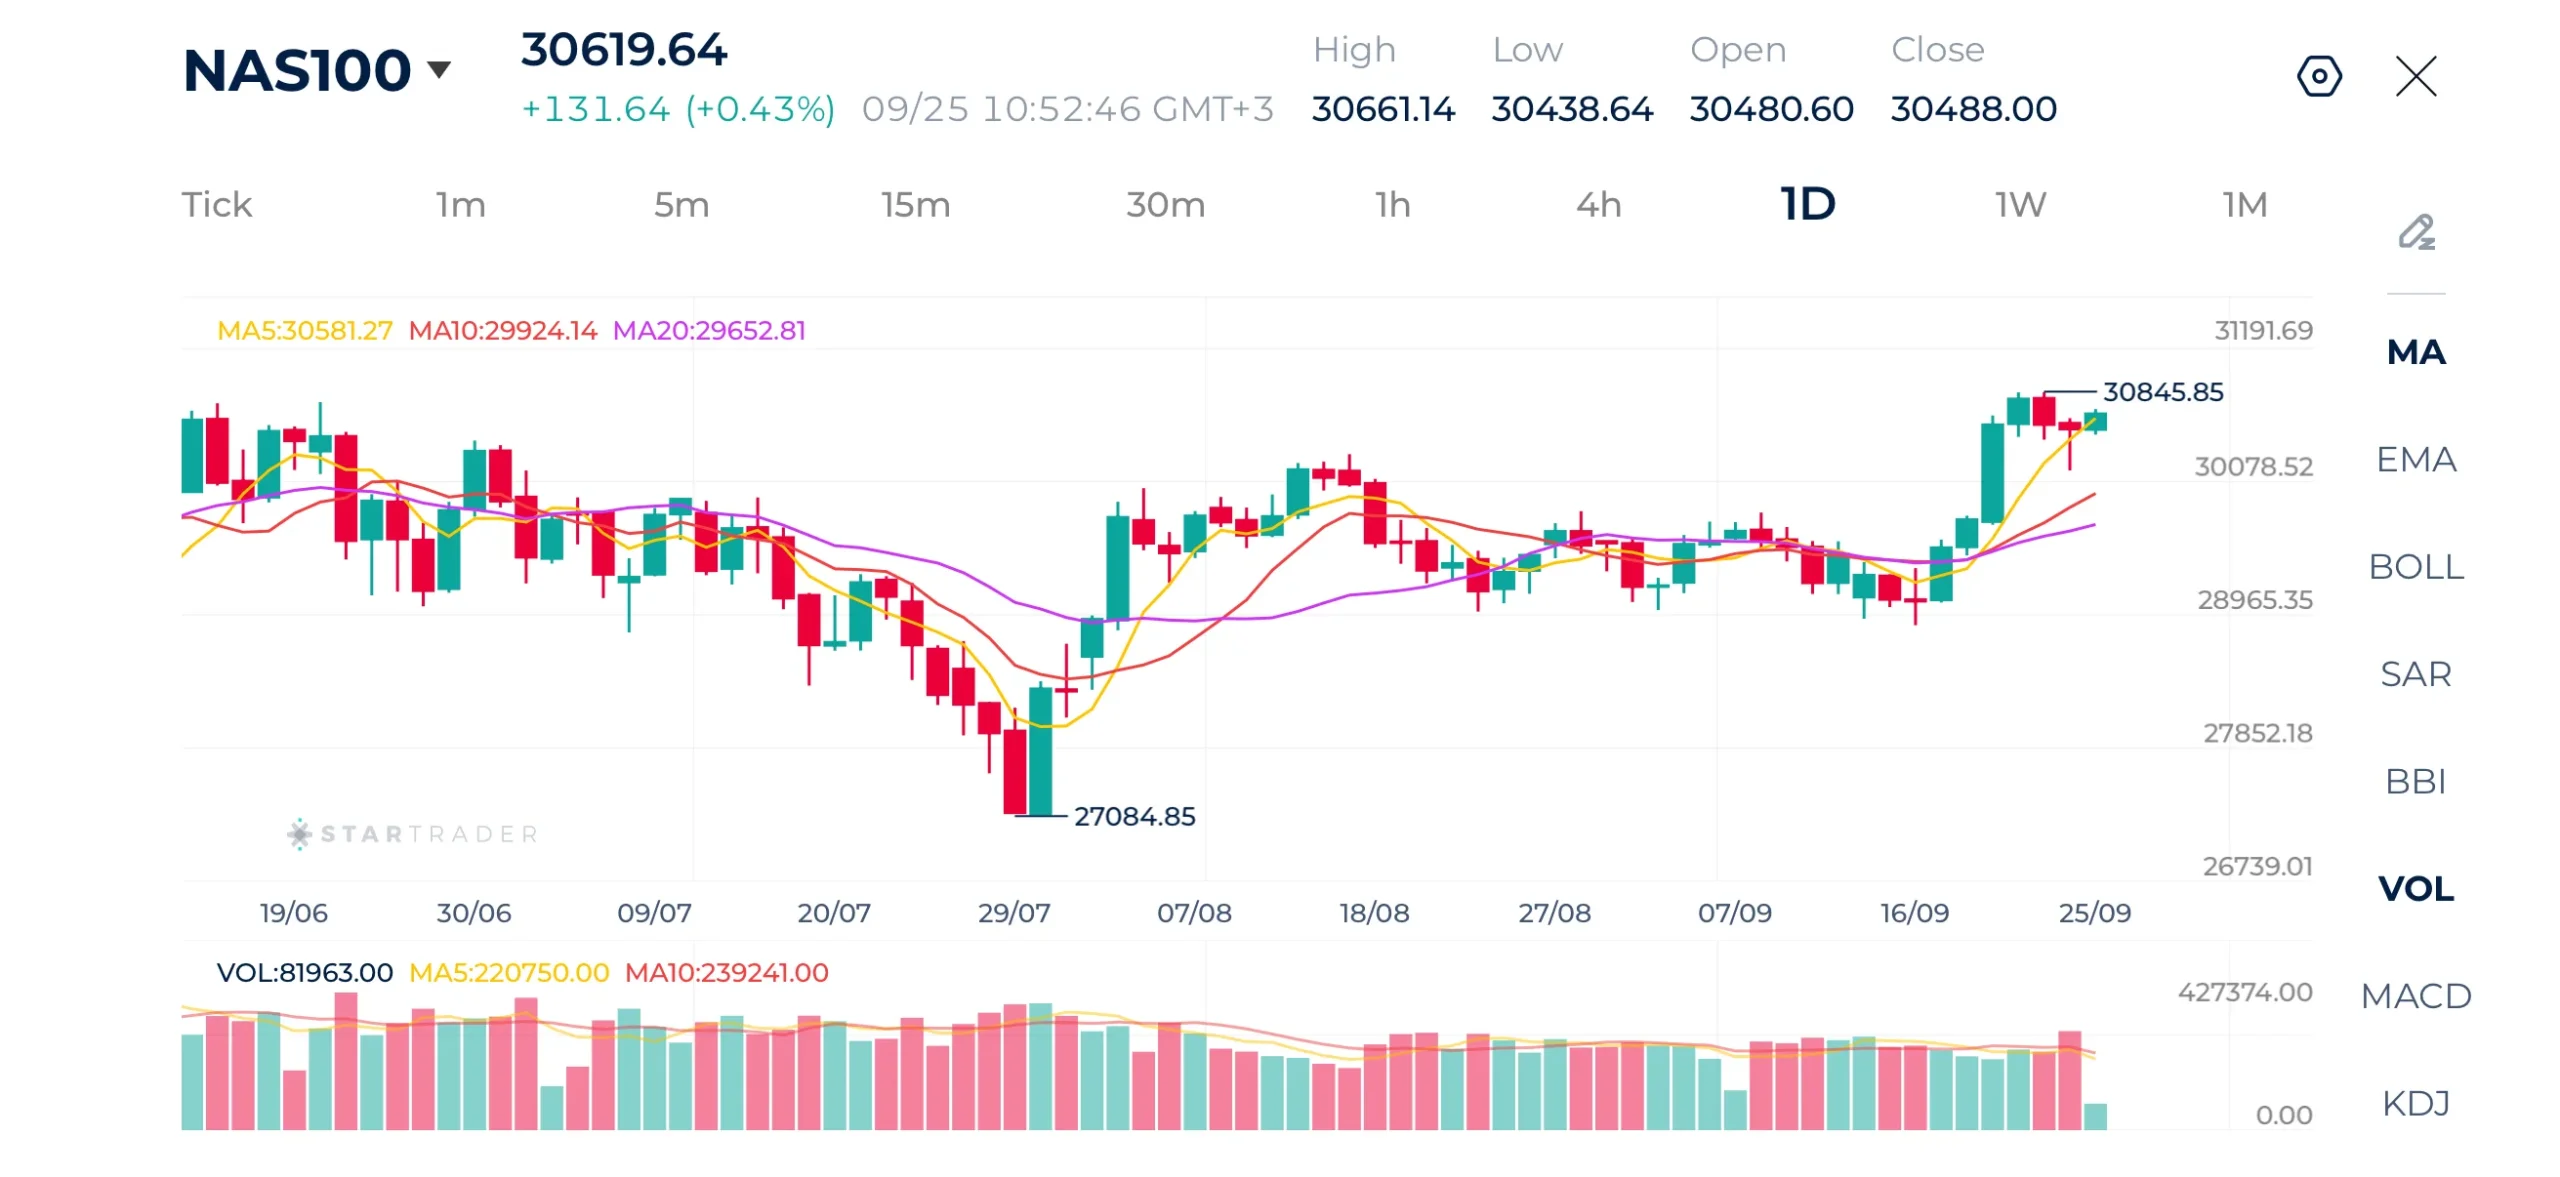
Nasdaq remains in a strong bullish structure, trading around 30,620 after recently reaching a new high of 30,845. The index has recovered sharply from the July low near 27,085, and price remains comfortably above the three moving averages MA5, MA10 and MA20.
The key resistance is the recent high at 30,845, followed by the psychological 31,000 level. On the downside, 30,078 is the first important support, followed by the 29,650 area.
The trend remains bullish, although the recent rally means some consolidation or profit-taking would not be unusual
Nasdaq Daily Chart
Source: STARTRADER app | Nasdaq trades near record highs led by AI companies
| Resistance | 30,845 – 30,860 | 31,000 – 31,026 | 31,126 – 31,140 |
|---|---|---|---|
| Support | 30,078 – 30,100 | 29,650 – 29,661 | 29,480 – 29,500 |
USDJPY Technical Analysis
USDJPY remains in a short-term bullish recovery, although the pair is currently pulling back slightly from the 158.90 area.
Immediate resistance is around 158.90, followed by the psychological 160.00 level. On the downside, 157.00–157.20 is the first support zone, followed by 156.43.
Overall, the chart remains constructive while USDJPY holds above the 156.4–157.0 support area.
USDJPY Daily Chart
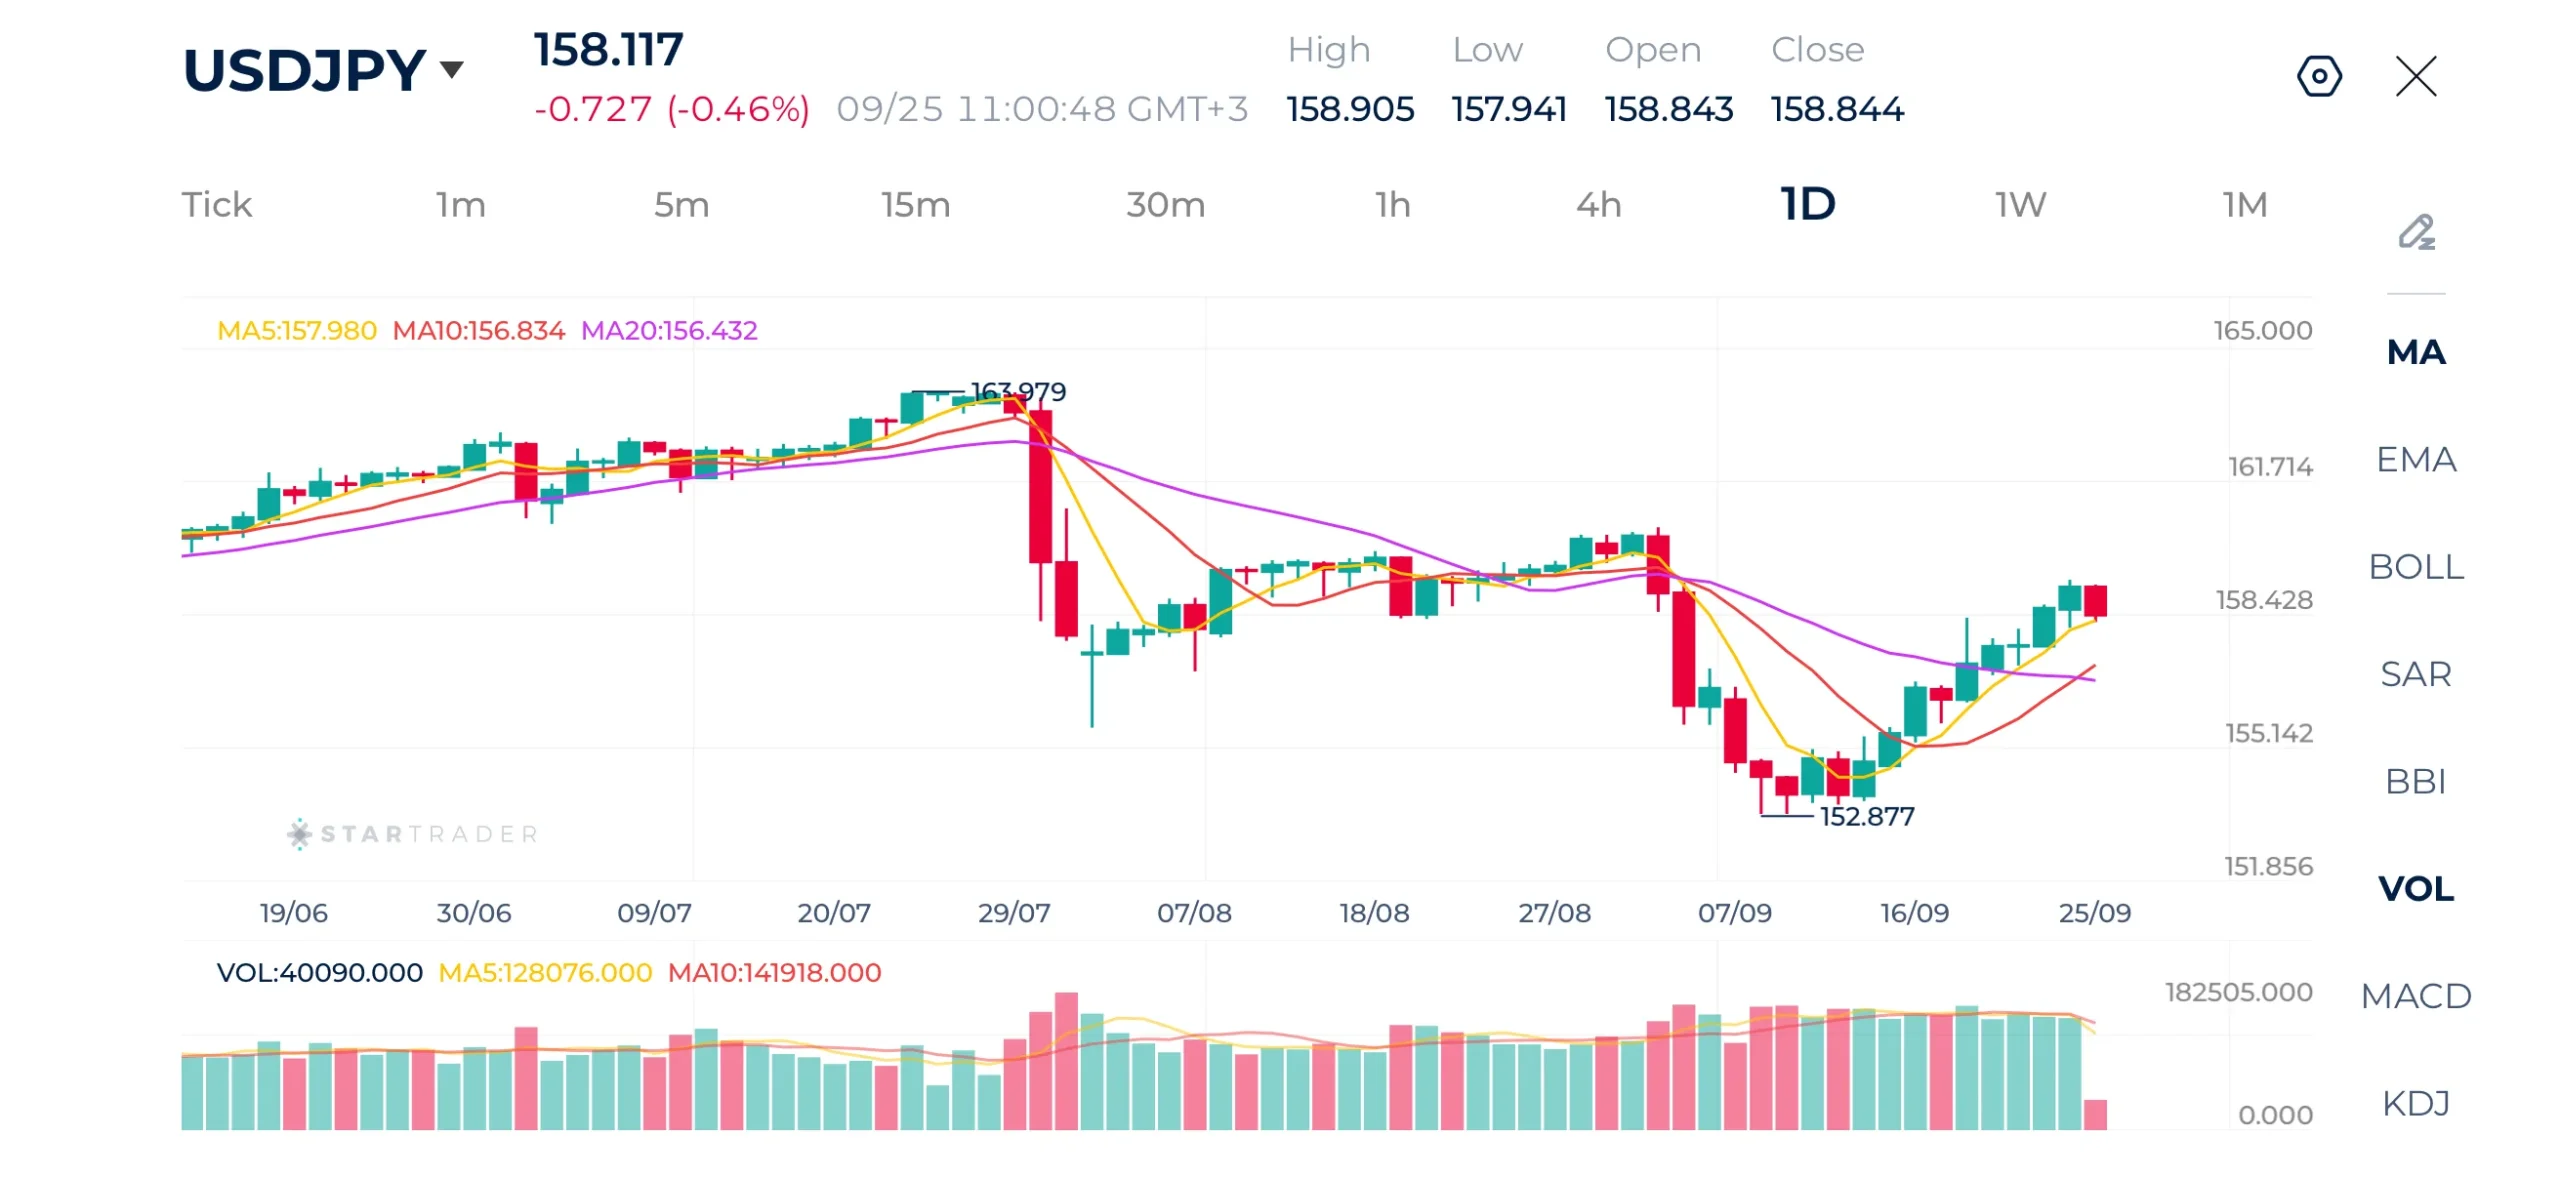
Source: STARTRADER app | Japanese Yen shows weakness despite the recent rate hike
| Resistance | 158.90 – 159.00 | 160.00 – 160.12 | 161.22 – 161.34 |
|---|---|---|---|
| Support | 157.20 – 157.33 | 156.40 – 156.46 | 155.24 – 155.30 |
Risk Disclaimer: This material is provided for informational purposes only and does not constitute a recommendation or investment advice. Trading financial instruments on margin involves substantial risk and may not be appropriate for all investors.
Tags


Open Live Account
 Email Address
 Phone Number
Important Notice
STARTRADER does not accept any applications from Australian residents.
To comply with regulatory requirements, clicking the button will redirect you to the STARTRADER website operated by STARTRADER PRIME GLOBAL PTY LTD (ABN 65 156 005 668), an authorized Australian Financial Services Licence holder (AFSL no. 421210) regulated by the Australian Securities and Investments Commission.
Important Notice for Residents of the United Arab Emirates
In alignment with local regulatory requirements, individuals residing in the United Arab Emirates are requested to proceed via our dedicated regional platform at startrader.ae, which is operated by STARTRADER Global Financial Consultation & Financial Analysis L.L.C.. This entity is licensed by the UAE Capital Market Authority (CMA) under License No. 20200000241, and is authorised to introduce financial services and promote financial products in the UAE.
Please click the "Continue" button below to be redirected.


