


Key Takeaways
- Oil prices softened as the U.S. capture of Maduro raised expectations for an influx of Venezuelan supply into global markets.
- Gold and Silver held firm near historic peaks as investors remained bullish on precious metals.
- Dow Jones and S&P 500 reached record highs, fueled by continued optimism and a broadening AI infrastructure rally.
- The Canadian Dollar weakened against the Greenback as the prospect of cheaper Venezuelan heavy crude threatened Canada’s export dominance.
- Bitcoin surged toward $94,000 before a mid-week profit-taking correction reset market sentiment to neutral.
Oil Prices Fluctuate Amid Concerns over Increased Supply
The capture of President Nicolás Maduro by U.S. forces on January 3rd sent mixed signals to the energy market. By Monday’s open, Brent and WTI crude saw only modest gains before stabilizing, as the market quickly pivoted from fear of disruption to the prospect of a supply increase. Despite Venezuela’s production of roughly 700,000–900,000 barrels per day, the country sits on the world’s largest proven reserves. On Monday, Brent prices fell to a low of $59.65 before bouncing back up and closing at $61.58 per barrel. WTI dropped to $56.17 and ended the day at $57.97.
Mid-week sentiment shifted toward a medium-term bearish outlook for crude prices as U.S.-led interim administration could fast-track the rehabilitation of PDVSA (Venezuela’s state oil company), potentially adding 300,000 to 400,000 barrels per day to global supply by year-end.
For most of the week, oil prices remained range-bound. On Thursday, prices rose by 3.7% on geopolitical uncertainty. While the overall trend of oil prices remains bearish, developments around the US-Venezuela relations will be a key catalyst for prices in the near future.
Precious Metals Settle Near Historic Highs
Precious metals began 2026 on the heels of a historic 2025, where Gold gained 64% and Silver a staggering 147%. Entering the week of January 5th, gold was trading near $4,465, staying within striking distance of its late December record of $4,550. This sustained high was also supported by geopolitical uncertainty in Venezuela. Gold settled around $4,475 by the end of the week.
Silver and Platinum also tested significant resistance levels this week. Silver benefited from a structural supply deficit entering its fifth year. Industrial demand for silver, particularly in green-tech and AI hardware, provided a solid floor that complemented its role as a monetary metal. Silver traded between $72.75 and $82.75 per ounce during the week.
Platinum followed suit, reaching peaks near $2,470 early in the week before seeing light profit-taking as the initial shock of the Venezuela intervention faded. Despite the U.S. dollar showing signs of stabilization mid-week, the broader trend of de-dollarization and high institutional demand for bullion kept prices elevated.
Dow Jones and S&P 500 Reach Record Fueled by the Energy Sector
The S&P 500 and the Dow Jones reached new heights this week, with the S&P 500 touching 6,965 The primary engine for this growth remained the AI Super-cycle. Investors essentially brushed off the geopolitical risks in Venezuela. A notable shift this week was the broadening of the rally. While 2025 was dominated by a handful of tech giants, the first week of January 2026 saw financials and energy starting off 2026 strong. Optimism was further fueled by policy signals from Washington. Rumors of a delay in scheduled tariff hikes and the potential for the Federal Reserve to continue its rate-cutting path created a positive environment for the market.
Dow Jones gained 1.78% during the week, breaking to new record highs at 49,620 on Wednesday. S&P 500 had modest gains of 0.77% following a new record high of 6,965. The Nasdaq 100 rose nearly 1%, but failed to advance to new record levels.
Key Economic Data of the week
- ISM Manufacturing PMI in the US fell to 47.9 in November, lower than market expectations of 48.3
- Australian CPI inflation fell to 3.4% in November, compared to 3.8% in October.
- ISM Services PMI in the US surprises to the upside with 54.4 reading, higher than market expectation of 52.2
- ADP Non-Farm Employment Change showed an increase of 41K jobs in December, but fell short of market expectations of 49K jobs.
- Inflation numbers in Switzerland come in line with expectations of 0.0%
Major Economic Calendar Events for the Upcoming Week
| Date | Metric | Country | Previous | Time [Dubai] |
| Monday, 12 January | 10-y Bond Auction | USA | 10:01 PM | |
| Tuesday, 13 January | Consumer Price Index y/y | USA | 2.70% | 5:30 PM |
| Tuesday, 13 January | New Home Sales | USA | 7:00 PM | |
| Wednesday, 14 January | Producer Price Index | USA | 5:30 PM | |
| Wednesday, 14 January | Retail Sales m/m | USA | 0.00% | 5:30 PM |
| Thursday, 15 January | Gross Domestic Product m/m | UK | -0.10% | 11:00 AM |
| Thursday, 15 January | Empire State Manufacturing Index | USA | -3.90% | 5:30 PM |
| Friday, 16 January | Housing Starts | Canada | 254K | 5:15 PM |
Technical Analysis and Forecast:
Brent Technical Analysis
Brent crude remains under pressure on the daily timeframe, with the broader structure still pointing to a downtrend despite a recent rebound from the $59 area. Price continues to trade below key moving averages, keeping the sequence of lower highs intact. Momentum is improving, as reflected by the MACD recovering from deeply negative levels, but this move currently appears corrective so far. Unless price can reclaim and hold above the $64–$66 resistance zone, rallies are likely to remain corrective, with downside risks persisting toward the $59–$58.5 support area.
Brent Daily Chart
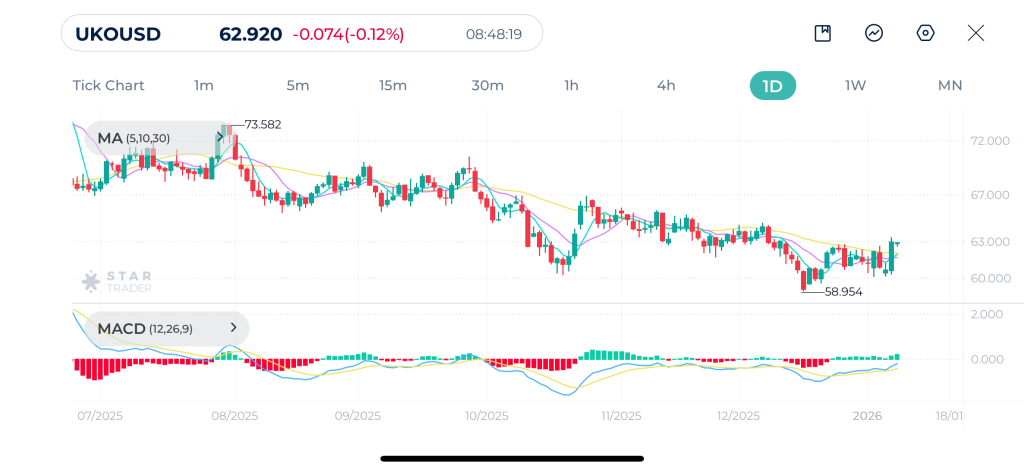
| Resistance | $62.76 – $62.80 | $63.52 – $63.60 | $64.00 – $64.10 |
| Support | $60.81 – $60.86 | $59.64 – $59.70 | $59.00 – $59.04 |
Dow Jones Technical Analysis
Dow Jones remains in a well-defined primary uptrend, with price continuing to form higher highs and higher lows. The index is holding comfortably above the 30-day moving average, which is acting as dynamic support and reinforcing the bullish structure. Momentum indicators support this view, as the MACD remains in positive territory and is stabilizing after a shallow pullback. As long as price holds above the 48,700–47,900 support zone, the broader bias remains bullish, with scope for a continuation toward the 49,650–49,800 resistance area.
Dow Jones Daily Chart
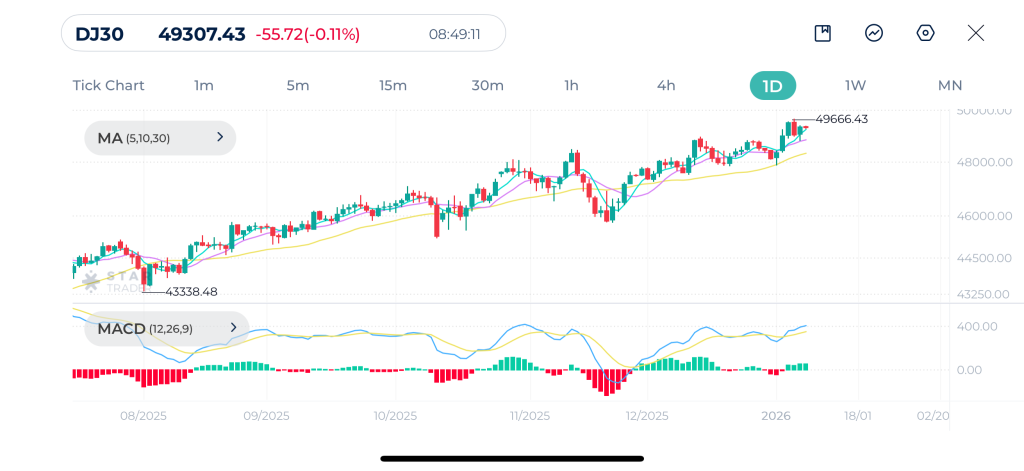
| Resistance | 49,622 – 49,630 | 49,721 – 49,735 | 49,811 – 49,829 |
| Support | 48,958 – 48,962 | 48,720 – 48,730 | 48,275 – 48,280 |
Gold Technical Analysis
Gold continues to trade within a strong long-term bullish trend, staying above all major moving averages. The recent pullback has been orderly and shallow, highlighting strong underlying demand and limited selling pressure. The MACD remains positive but has flattened slightly, pointing to short-term consolidation. As long as gold holds above the $4,380–$4,250 support zone, the broader outlook remains constructive, with a potential continuation toward the $4,550–$4,600 resistance region.
Gold Daily Chart
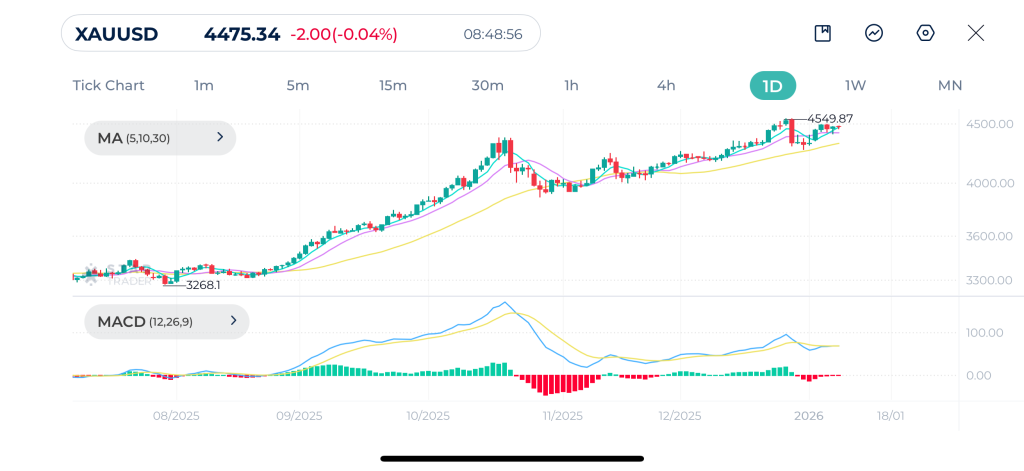
| Resistance | $4,505 – $4,510 | $4,550 – $4,555 | $4,580 – $4,585 |
| Support | $4,400 – $4,406 | $4,338 – $4,345 | $4,275 – $4,280 |
EURUSD Technical Analysis
After a recovery rally in December, EURUSD hit a double top near 1.1800 and is currently trending lower. This downward trajectory is attributed to renewed U.S. Dollar strength.
The faster moving averages MA(5) and MA(10) are acting as immediate resistance. The price is currently trading below both, signaling immediate bearish pressure. The 30-day average is currently positioned near 1.1700. The price has broken decisively below this level, which often triggers a transition from a bullish to a bearish medium-term outlook.
The most immediate support level lies around 1.1600. A break below this level could bring the price further down to 1.1500. On the other hand, failure to close below this psychological support could push the pair higher.
EURUSD Daily Chart EURUSD
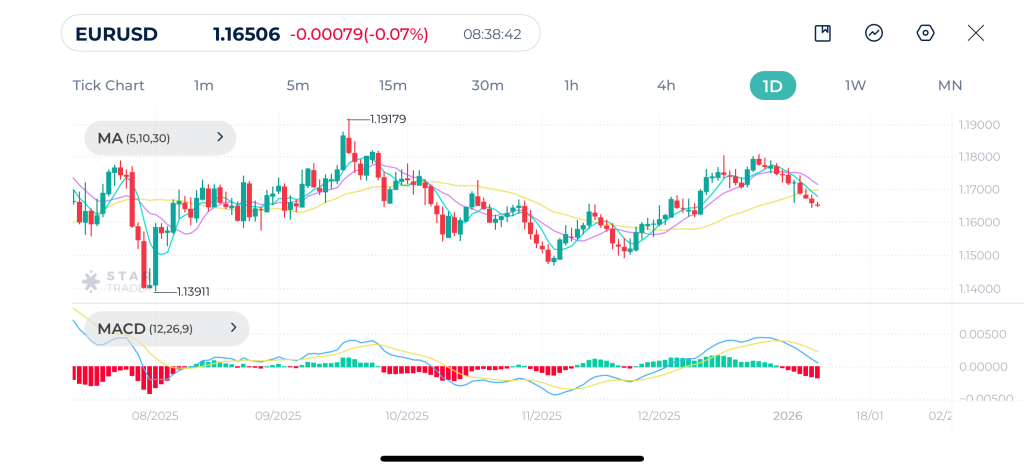
| Resistance | 1.1702 – 1.1710 | 1.1742 – 1.1750 | 1.1778 – 1.1791 |
| Support | 1.1620 – 1.1627 | 1.1587 – 1.1600 | 1.1530 – 1.1540 |
Tags
Open Live Account
Please enter a valid country
No results found
No results found
Please enter a valid email
Please enter a valid verification code
1. 8-16 characters + numbers (0-9) 2. blend of letters (A-Z, a-z) 3. special characters (e.g, !a#S%^&)
Please enter the correct format
Please tick the checkbox to proceed
Please tick the checkbox to proceed
Important Notice
STARTRADER does not accept any applications from Australian residents.
To comply with regulatory requirements, clicking the button will redirect you to the STARTRADER website operated by STARTRADER PRIME GLOBAL PTY LTD (ABN 65 156 005 668), an authorized Australian Financial Services Licence holder (AFSL no. 421210) regulated by the Australian Securities and Investments Commission.
CONTINUEImportant Notice for Residents of the United Arab Emirates
In alignment with local regulatory requirements, individuals residing in the United Arab Emirates are requested to proceed via our dedicated regional platform at startrader.ae, which is operated by STARTRADER Global Financial Consultation & Financial Analysis L.L.C.. This entity is licensed by the UAE Capital Market Authority (CMA) under License No. 20200000241, and is authorised to introduce financial services and promote financial products in the UAE.
Please click the "Continue" button below to be redirected.
CONTINUEError! Please try again.

