


Brent Technical Analysis
After a sustained climb from the $60.14 low last week, price peaked near $66.14 today. We are currently seeing a rounding top on the hourly chart as it struggles to maintain the steep slope of the rally.
Price is currently sitting right on the shorter-term moving averages. If it closes significantly below these lines, it may seek support at the 30-period moving average around $64.50
MACD line has crossed below the signal line. This indicates that upward momentum has exhausted for now, and a corrective phase is underway. The short term trend remains bullish, driven by fundamentals.
Brent 1H Chart
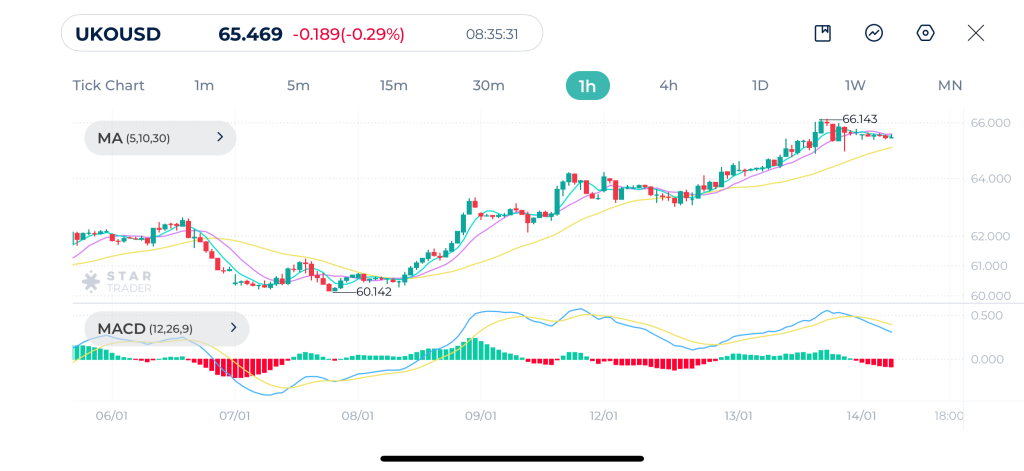
| Resistance | $65.20 | $65.56 | $66.00 |
| Support | $64.34 | $64.05 | $63.44 |
USDJPY Technical Analysis
USDJPY has been making higher highs and higher lows with highs clearly seen on the hourly chart. It recently hit a peak of 159.44.
Price is finding support at the the short-term moving averages. As long as it stays above 158.80, the upward trend is firmly intact.
MACD shows a potential double top in momentum. While the price is still high, the strength of the buying is slowing down, suggesting we might see a brief dip back to the 158.50 area before the next leg up.
USDJPY 1H Chart
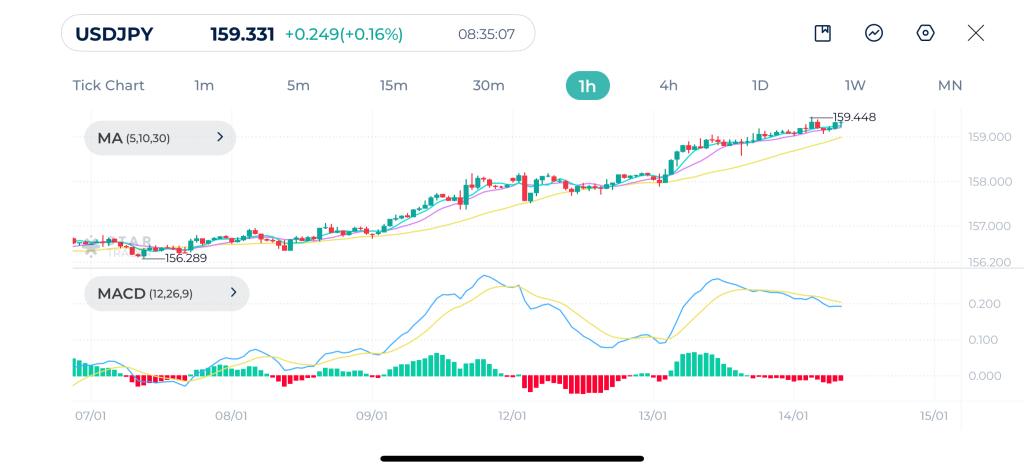
| Resistance | 159.46 | 159.90 | 160.24 |
| Support | 159.06 | 158.64 | 158.23 |
Bitcoin Technical Analysis
After months of consolidation, Bitcoin broke above $96,000. However, the last few candles show long upper shadows, indicating heavy selling pressure at the $96,000 level.
Price remains well above the 30-period moving average, which is a sign of strength. However, the gap between the price and the moving average suggests the cryptocurrency is overextended and might need to trade sideways to let the averages catch up.
MACD lines are beginning to curl downward, indicating a possible consolidation between $92,000 and $95,000.
Bitcoin 1H Chart
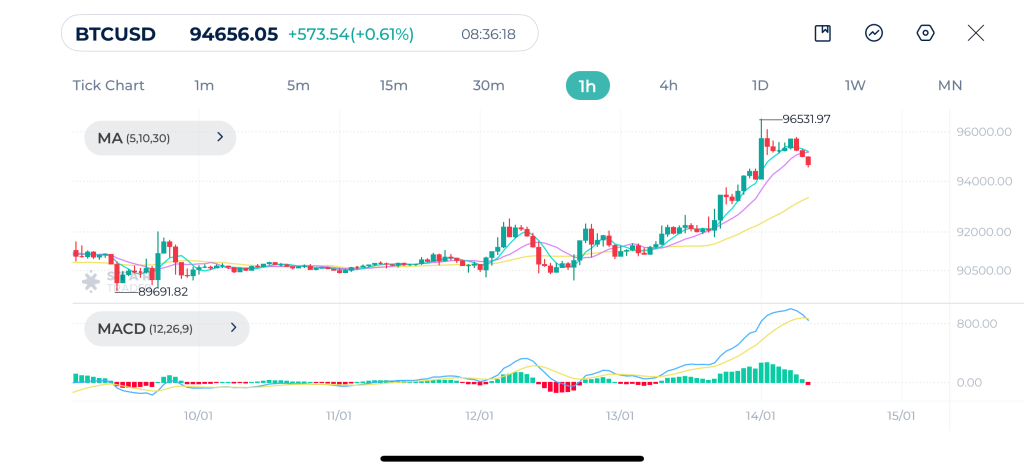
| Resistance | $95,736 | $97,140 | $98,000 |
| Support | $94,384 | $93,210 | $92,187 |
Tags
Open Live Account
Please enter a valid country
No results found
No results found
Please enter a valid email
Please enter a valid verification code
1. 8-16 characters + numbers (0-9) 2. blend of letters (A-Z, a-z) 3. special characters (e.g, !a#S%^&)
Please enter the correct format
Please tick the checkbox to proceed
Please tick the checkbox to proceed
Important Notice
STARTRADER does not accept any applications from Australian residents.
To comply with regulatory requirements, clicking the button will redirect you to the STARTRADER website operated by STARTRADER PRIME GLOBAL PTY LTD (ABN 65 156 005 668), an authorized Australian Financial Services Licence holder (AFSL no. 421210) regulated by the Australian Securities and Investments Commission.
CONTINUEImportant Notice for Residents of the United Arab Emirates
In alignment with local regulatory requirements, individuals residing in the United Arab Emirates are requested to proceed via our dedicated regional platform at startrader.ae, which is operated by STARTRADER Global Financial Consultation & Financial Analysis L.L.C.. This entity is licensed by the UAE Capital Market Authority (CMA) under License No. 20200000241, and is authorised to introduce financial services and promote financial products in the UAE.
Please click the "Continue" button below to be redirected.
CONTINUEError! Please try again.

