


Silver Technical Analysis
Silver shows a strong uptrend on the hourly chart as the precious metal nears its all-time high. Price has recently hit a high of $49.53 and is currently experiencing a slight pullback or consolidation just below this peak. The series of higher highs and higher lows confirms the bullish momentum.
The price is trading above the short-term moving average MA(5),medium-term (MA10), and longer-term (MA30), which is a classic bullish signal.
The MACD line is above the Signal line, and both are above the zero line, confirming the strong bullish trend.
A decisive break and close above the recent high of $49.53 would likely target the $50 psychological level.
However, a drop and sustained trade below the 30-period moving average and the zero line on the MACD would signal a deeper correction or trend reversal.
Silver 1H Chart
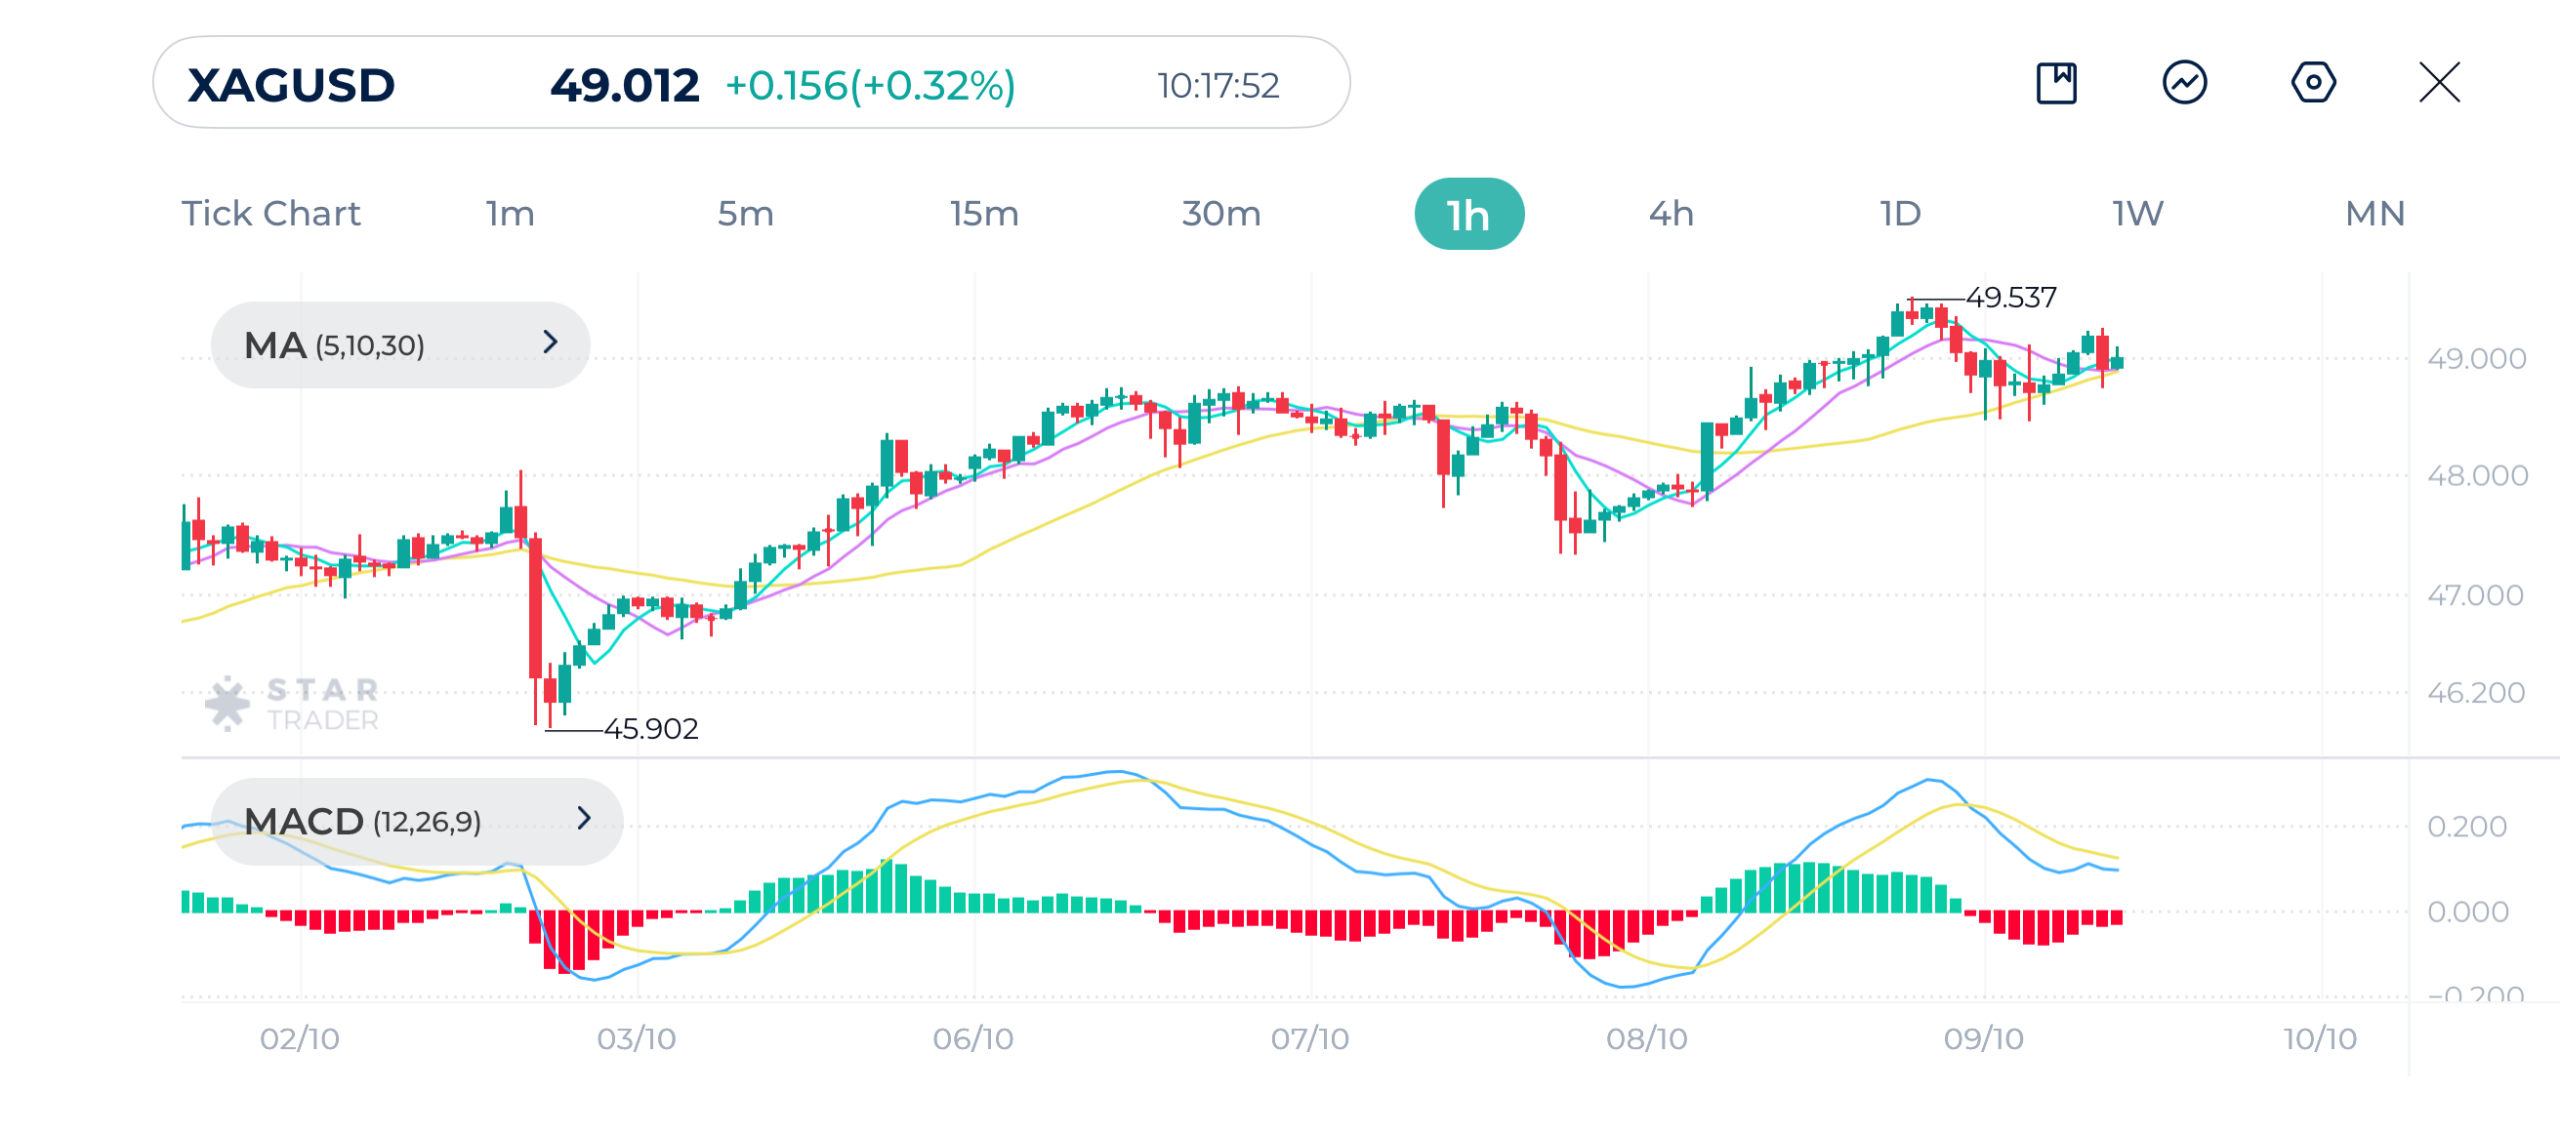
| Resistance | $49.26 | $49.50 | $50.00 |
| Support | $48.42 | $48.00 | $47.30 |
EURUSD Technical Analysis
EURUSD chart shows a strong and sustained downtrend starting from a high near 1.1758. The pair has been making lower highs and lower lows, indicating strong selling pressure. Recently, the pair bottomed near 1.1597 and is currently attempting a small upward correction.
The price has been trading consistently below all three Moving Averages (5, 10, and 30 periods) throughout the downtrend, a strong bearish signal.
Recently, the MACD line has crossed above the Signal line, and the histogram bars have turned green, both occurring near the low of 1.15979.
Bearish Scenario: The primary trend is bearish. The correction is likely to stall and reverse upon reaching the resistance from the moving averages. Bullish Scenario: A sustained break and close above the 30-period MA, coupled with the MACD lines crossing above the zero line, would be required to suggest a deeper reversal or a change in the overall trend.
EURUSD 1H Chart
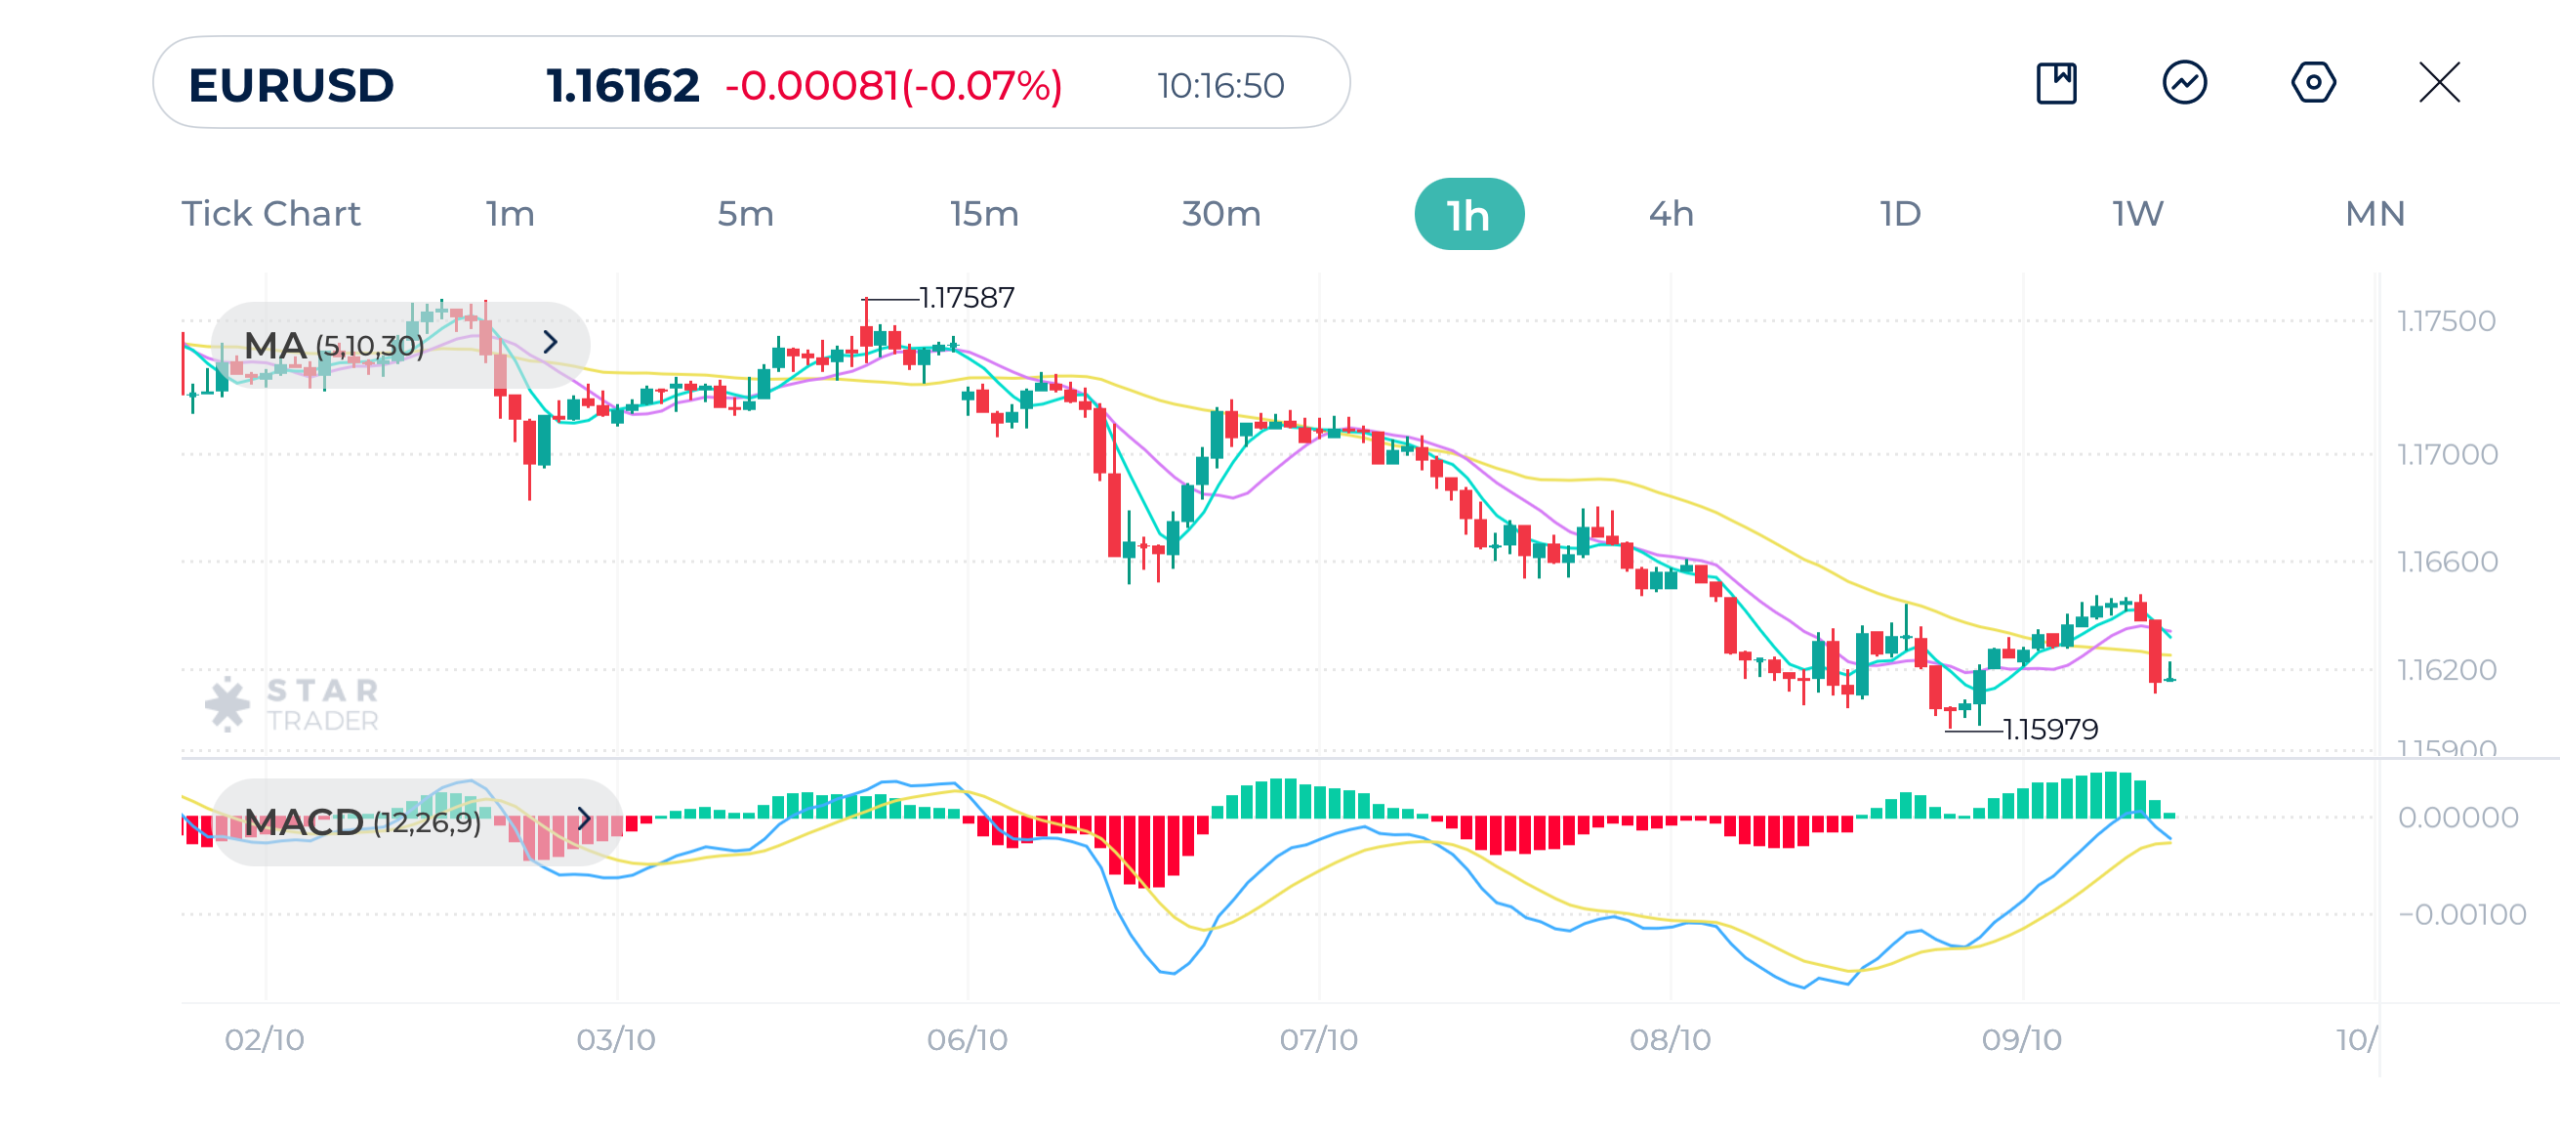
| Resistance | 1.1648 | 1.1681 | 1.1721 |
| Support | 1.1589 | 1.1546 | 1.1502 |
Nasdaq Technical Analysis
Nasdaq 100 shows a clear uptrend as it outperforms the other major US indices. The index peaked at 25,220.18 and is currently undergoing a minor retracement. The candles show a strong push up into a consolidation phase.
The price is trading above all three Moving Averages (5, 10, and 30 periods), which is a bullish indicator.
The MACD line is above the Signal line and the zero line, indicating an active uptrend.
A close above 25,220 would likely continue the rally. But a sustained move below the cluster of moving averages (around 25,000) would confirm the short-term correction.
Nasdaq 1H Chart
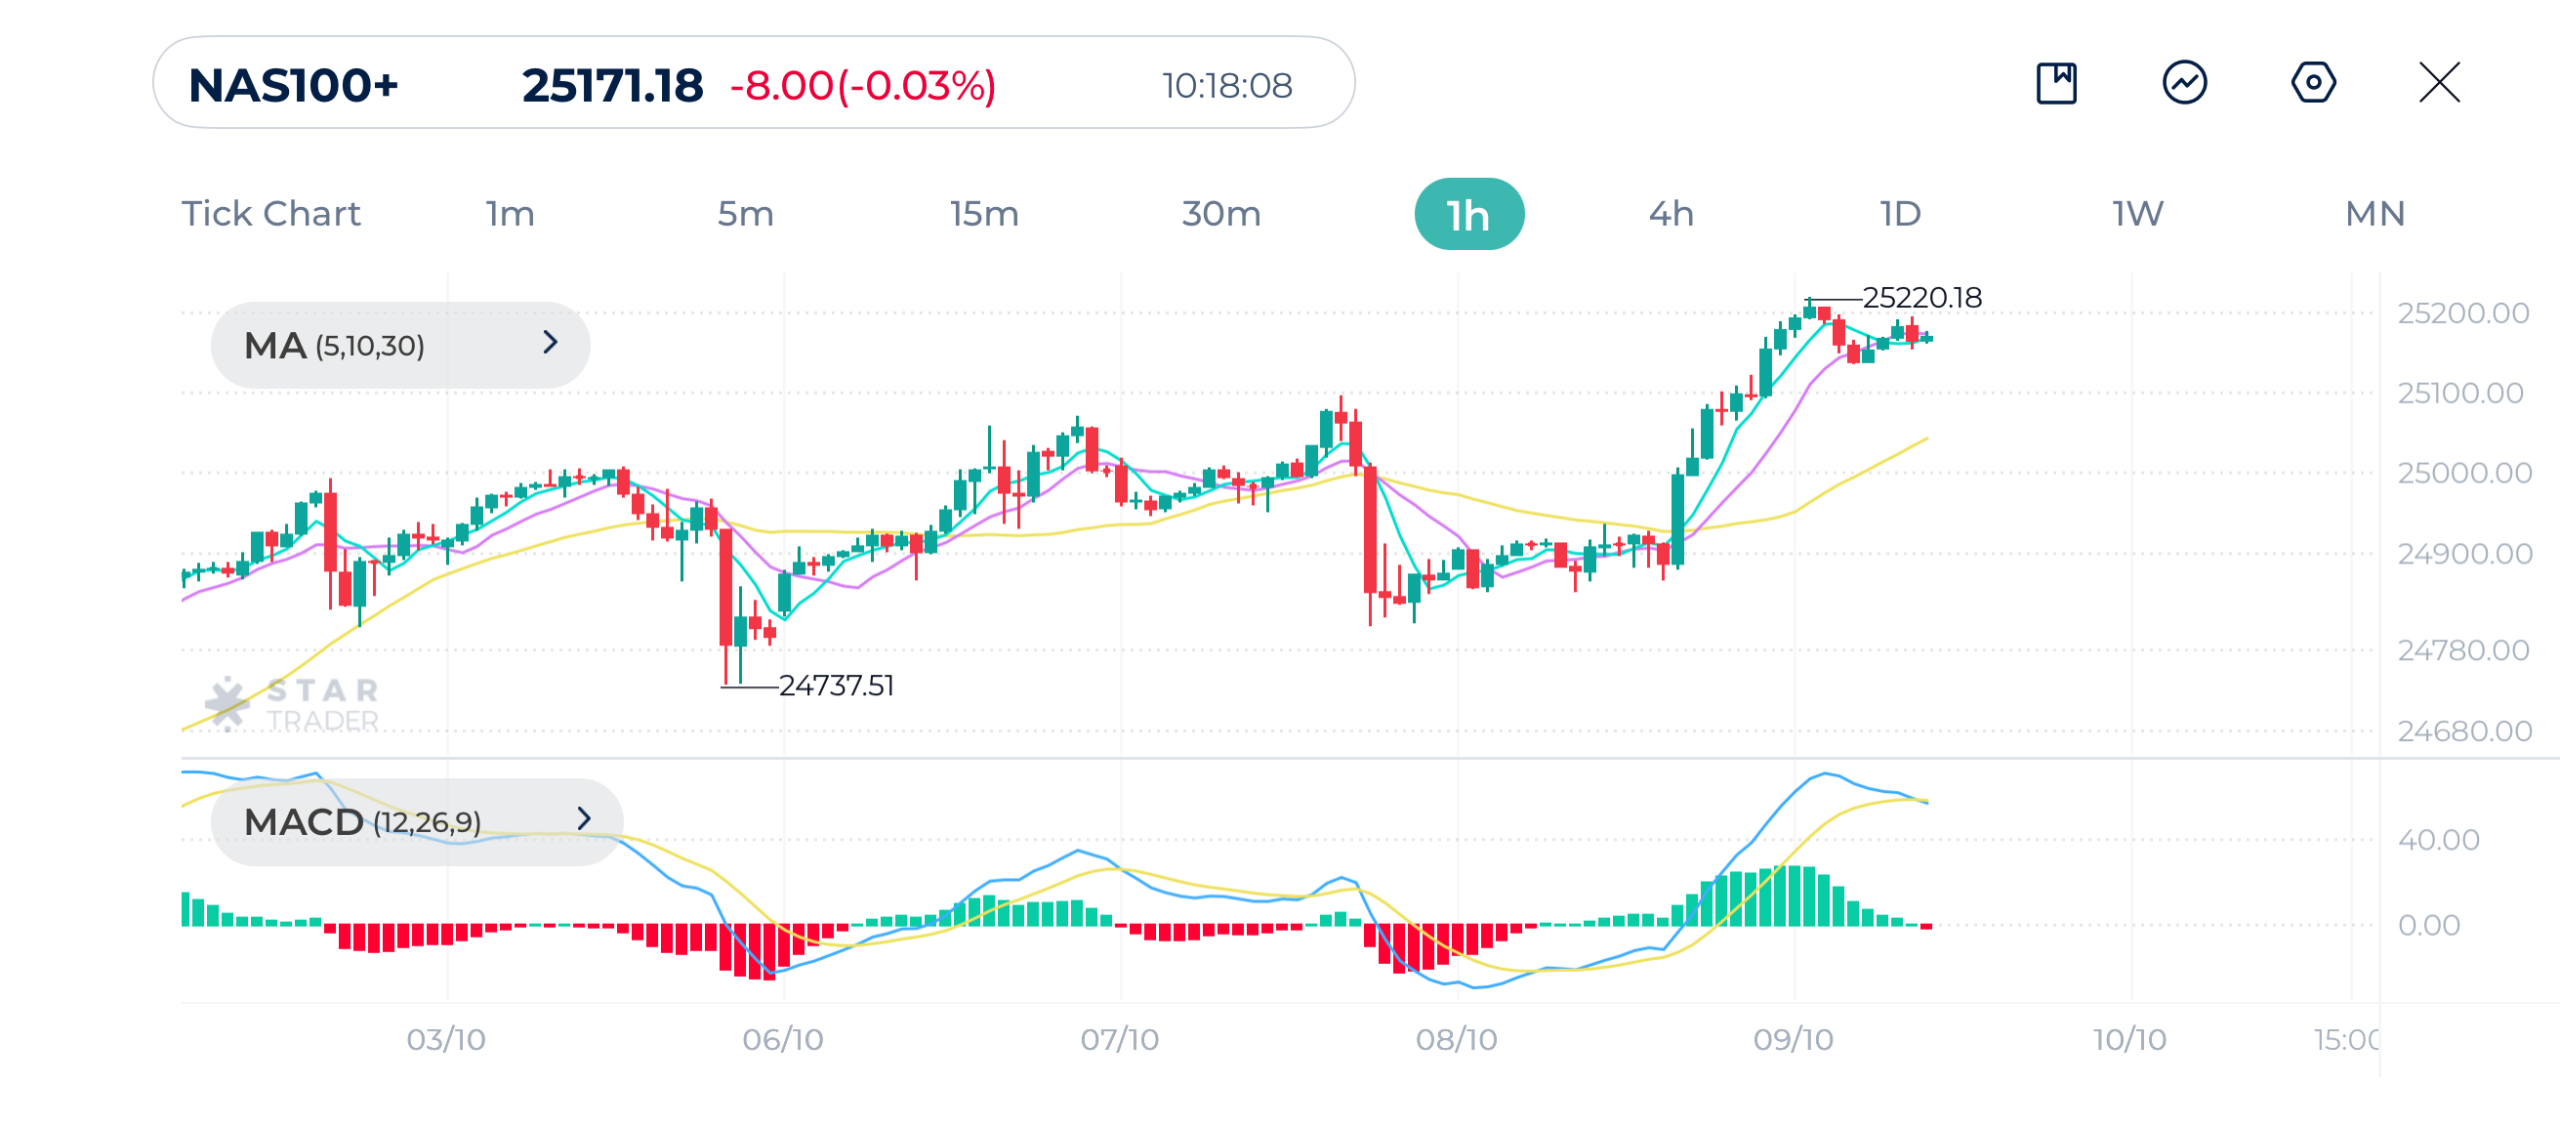
| Resistance | 25,192 | 25,250 | 25,400 |
| Support | 25,100 | 25,054 | 24,840 |
Tags
Open Live Account
Please enter a valid country
No results found
No results found
Please enter a valid email
Please enter a valid verification code
1. 8-16 characters + numbers (0-9) 2. blend of letters (A-Z, a-z) 3. special characters (e.g, !a#S%^&)
Please enter the correct format
Please tick the checkbox to proceed
Please tick the checkbox to proceed
Important Notice
STARTRADER does not accept any applications from Australian residents.
To comply with regulatory requirements, clicking the button will redirect you to the STARTRADER website operated by STARTRADER PRIME GLOBAL PTY LTD (ABN 65 156 005 668), an authorized Australian Financial Services Licence holder (AFSL no. 421210) regulated by the Australian Securities and Investments Commission.
CONTINUEImportant Notice for Residents of the United Arab Emirates
In alignment with local regulatory requirements, individuals residing in the United Arab Emirates are requested to proceed via our dedicated regional platform at startrader.ae, which is operated by STARTRADER Global Financial Consultation & Financial Analysis L.L.C.. This entity is licensed by the UAE Capital Market Authority (CMA) under License No. 20200000241, and is authorised to introduce financial services and promote financial products in the UAE.
Please click the "Continue" button below to be redirected.
CONTINUEError! Please try again.

