


GBPUSD Technical Analysis
GBPUSD shows weakness in the trend after failing to hold above 1.3700. Price recently dropped below short-term moving averages MA(5) and MA(10), indicating short-term bearish pressure.
30-period moving average is still holding as support, but is being tested now. Bearish crossover just happened on MACD.
The outlook is bearish in the short term, especially if the pair falls below 1.3400. If it holds, range trading is possible.
GBPUSD 1H Chart
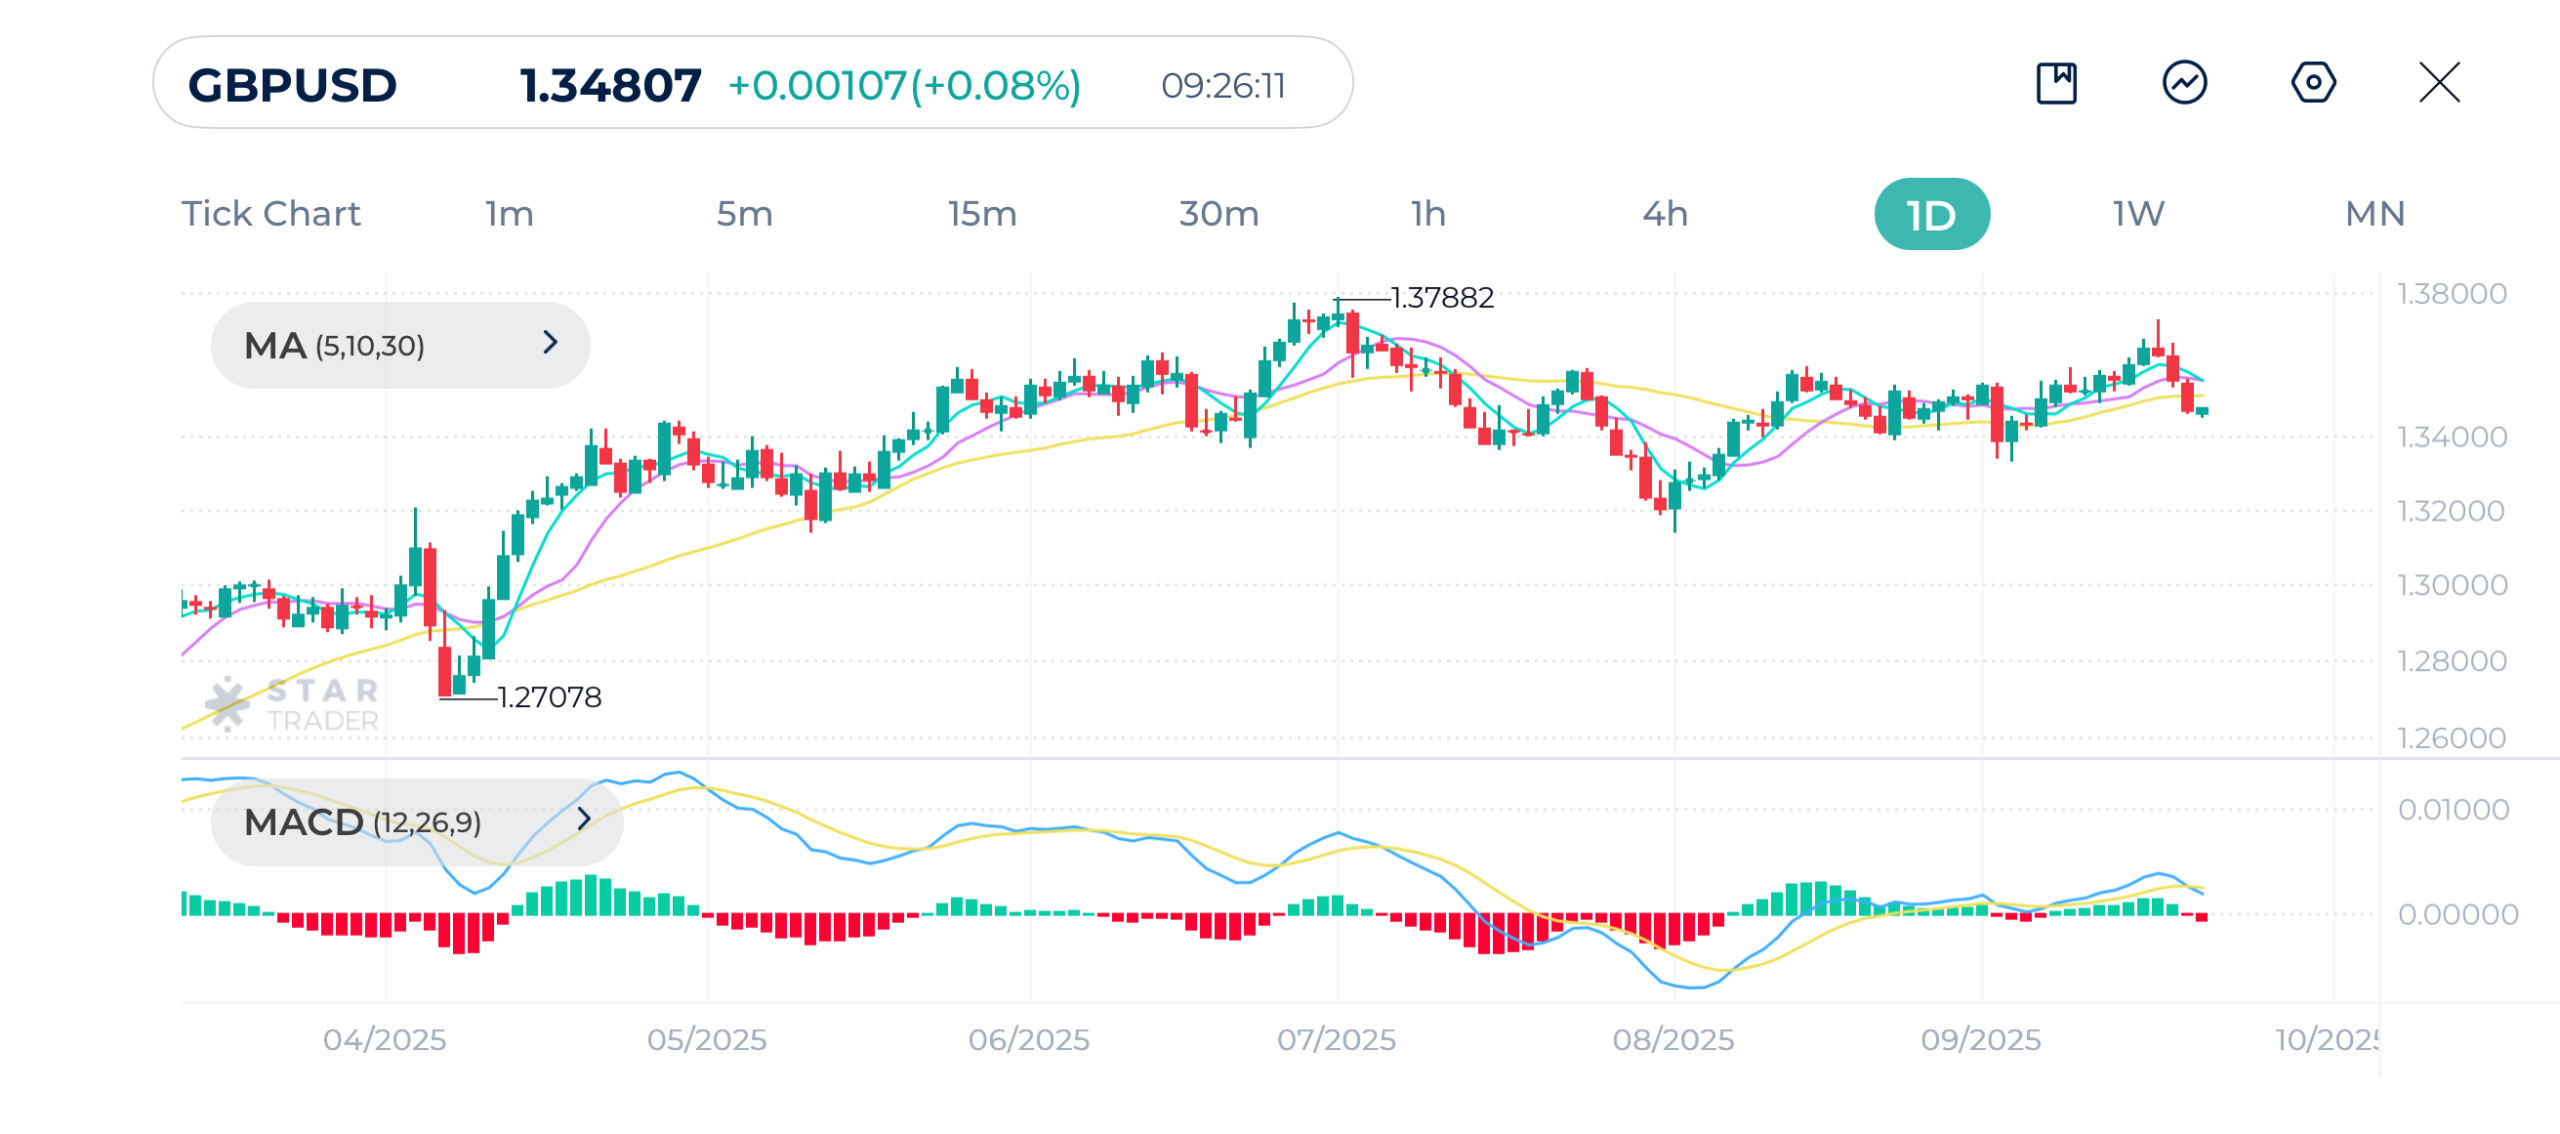
| Resistance | 1.3500 | 1.3531 | 1.3586 |
| Support | 1.3453 | 1.3400 | 1.3375 |
Gold Technical Analysis
Gold has shown a strong bullish rally since mid-August, but is now consolidating just under $3,710.
Price is well above the moving average MA(30), with MA(5) and MA(10) holding as dynamic support.
This is a classic bullish setup.
MACD is currently positive but is weakening, indicating that momentum is slowing, possible short-term consolidation.
The outlook for gold is bullish long-term but looks overextended in the short term. Correction toward $3,600 would be healthy before another leg upward.
Gold (XAUUSD) 1H Chart
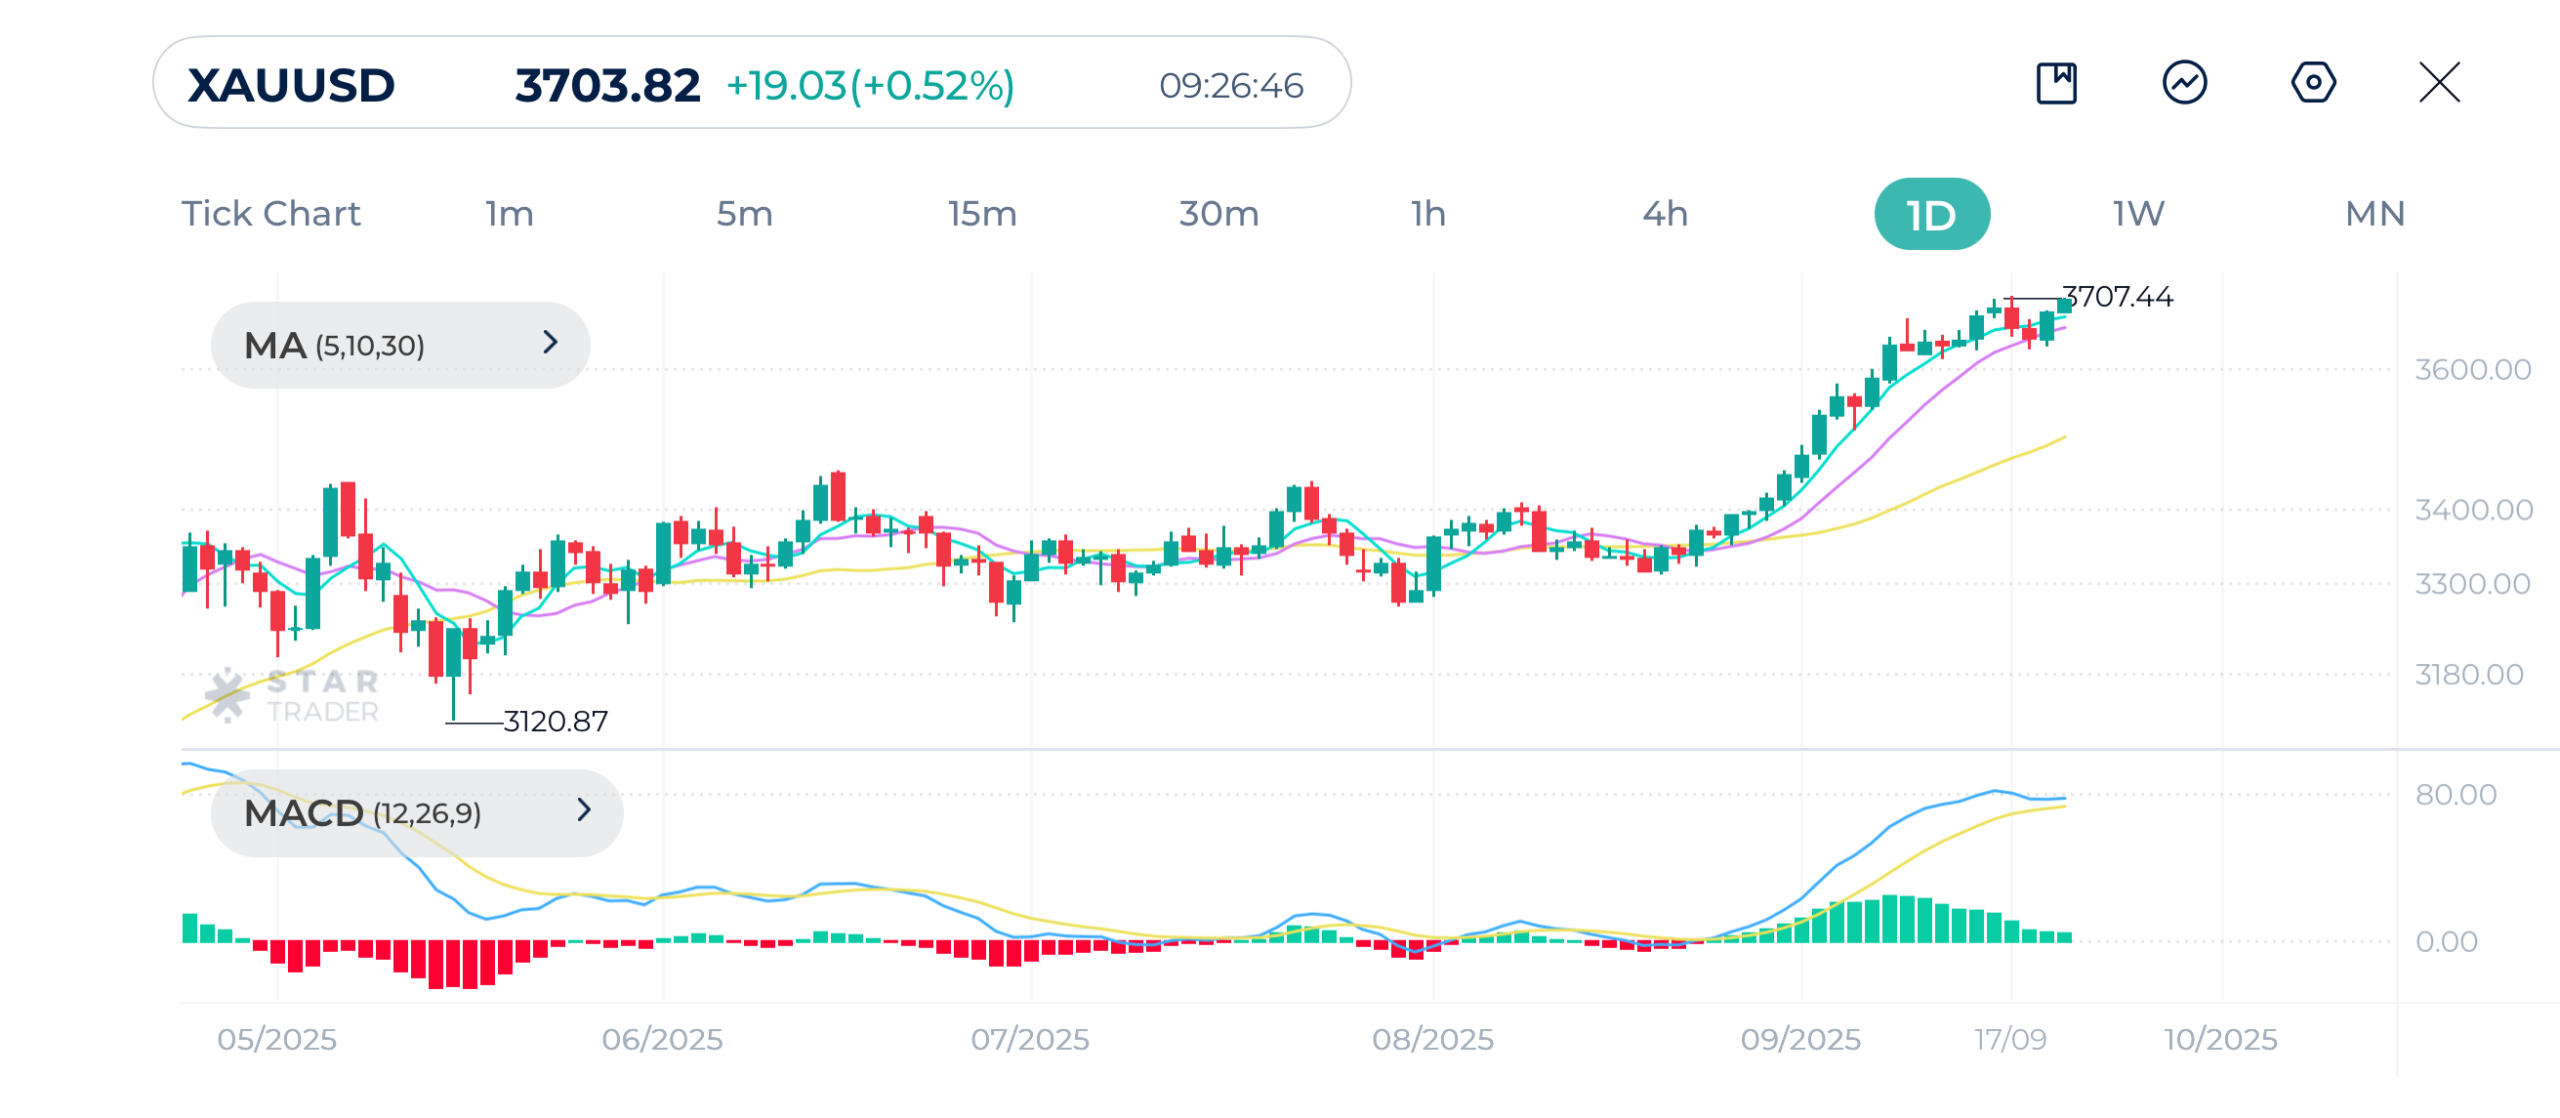
| Resistance | $3,725 | $3,750 | $3,800 |
| Support | $3,685 | $3,666 | $3,643 |
Nasdaq Technical Analysis
Nasdaq is currently in a clear uptrend since early September, making higher highs and higher lows.
The short-term moving averages MA(5) and MA(10) are above the 30-period moving average, confirming bullish momentum. Price is well above the moving average MA(30), which signals strong underlying support.
MACD recently turned positive and showing momentum is picking up. It’s important to watch out for the key psychological support level of 24,000.
The outlook remains bullish above 24,400. Closure below this level may cause further declines.
Nasdaq 1H Chart
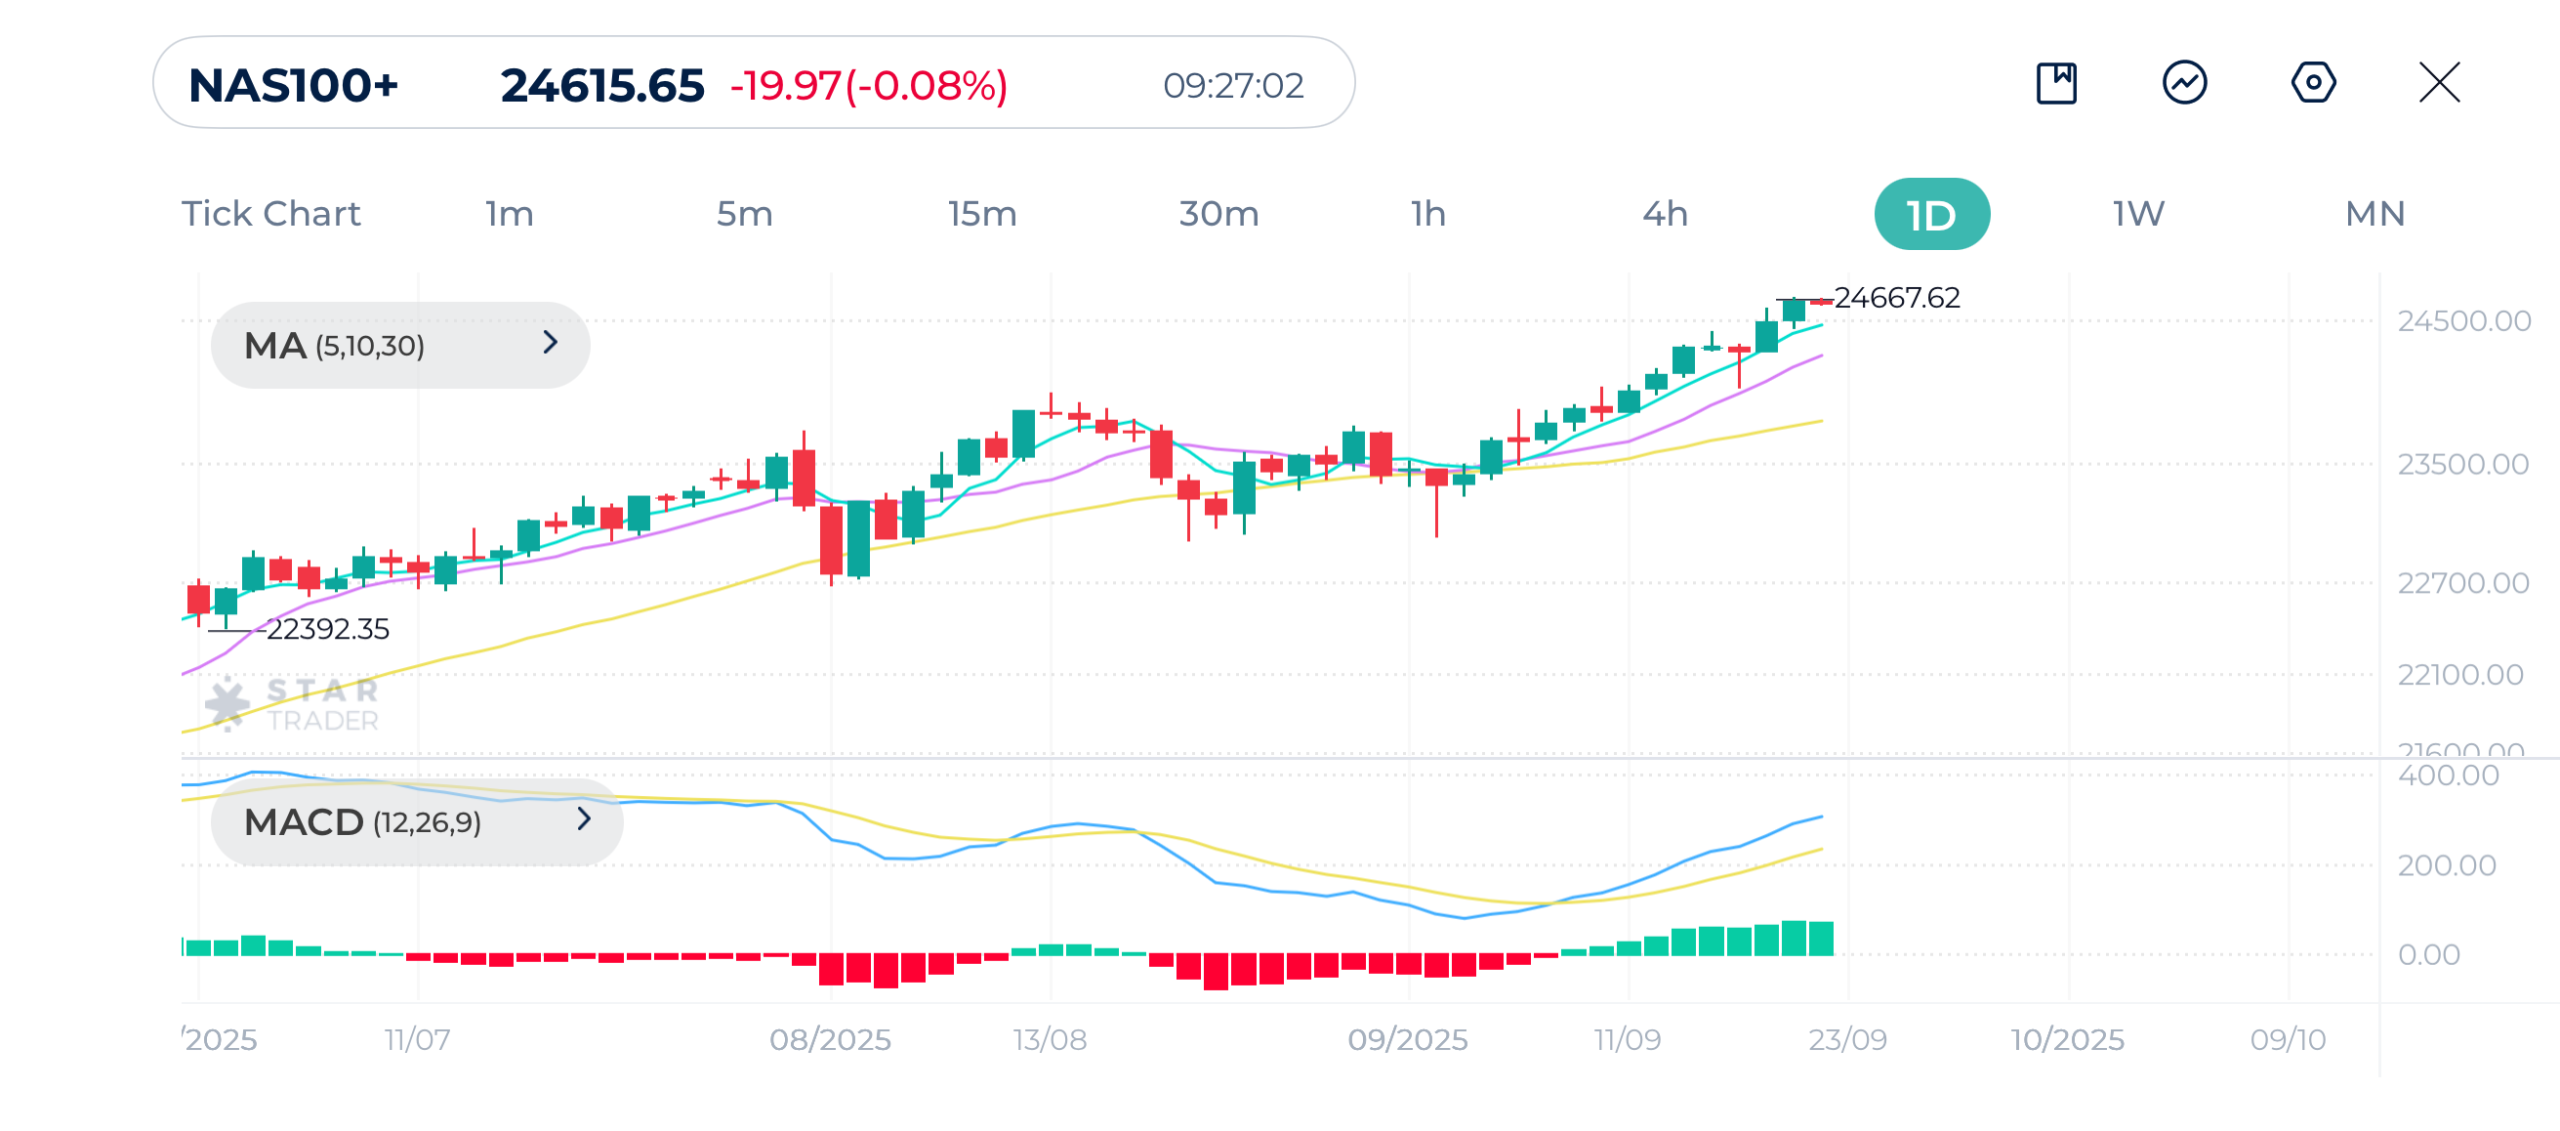
| Resistance | 24,636 | 24,700 | 24,750 |
| Support | 24,549 | 24,495 | 24,464 |
Tags
Open Live Account
Please enter a valid country
No results found
No results found
Please enter a valid email
Please enter a valid verification code
1. 8-16 characters + numbers (0-9) 2. blend of letters (A-Z, a-z) 3. special characters (e.g, !a#S%^&)
Please enter the correct format
Please tick the checkbox to proceed
Please tick the checkbox to proceed
Important Notice
STARTRADER does not accept any applications from Australian residents.
To comply with regulatory requirements, clicking the button will redirect you to the STARTRADER website operated by STARTRADER PRIME GLOBAL PTY LTD (ABN 65 156 005 668), an authorized Australian Financial Services Licence holder (AFSL no. 421210) regulated by the Australian Securities and Investments Commission.
CONTINUEImportant Notice for Residents of the United Arab Emirates
In alignment with local regulatory requirements, individuals residing in the United Arab Emirates are requested to proceed via our dedicated regional platform at startrader.ae, which is operated by STARTRADER Global Financial Consultation & Financial Analysis L.L.C.. This entity is licensed by the UAE Capital Market Authority (CMA) under License No. 20200000241, and is authorised to introduce financial services and promote financial products in the UAE.
Please click the "Continue" button below to be redirected.
CONTINUEError! Please try again.

