


Ethereum Technical Analysis
Ethereum continues its strong uptrend as it broke above $3,400. The price has been consistently moving above all key moving averages, with the MA 30 providing solid support. The hourly chart shows consolidation near the recent highs, but the overall trend remains decisively upward.
Price might see a bearish correction toward $4,200, before continuing up, a normal price action during uptrend movements.
A breakout above $4,350 would likely extend gains toward the $4,400–$4,500 range, as buying pressure holds.
ETHUSD 1H Chart
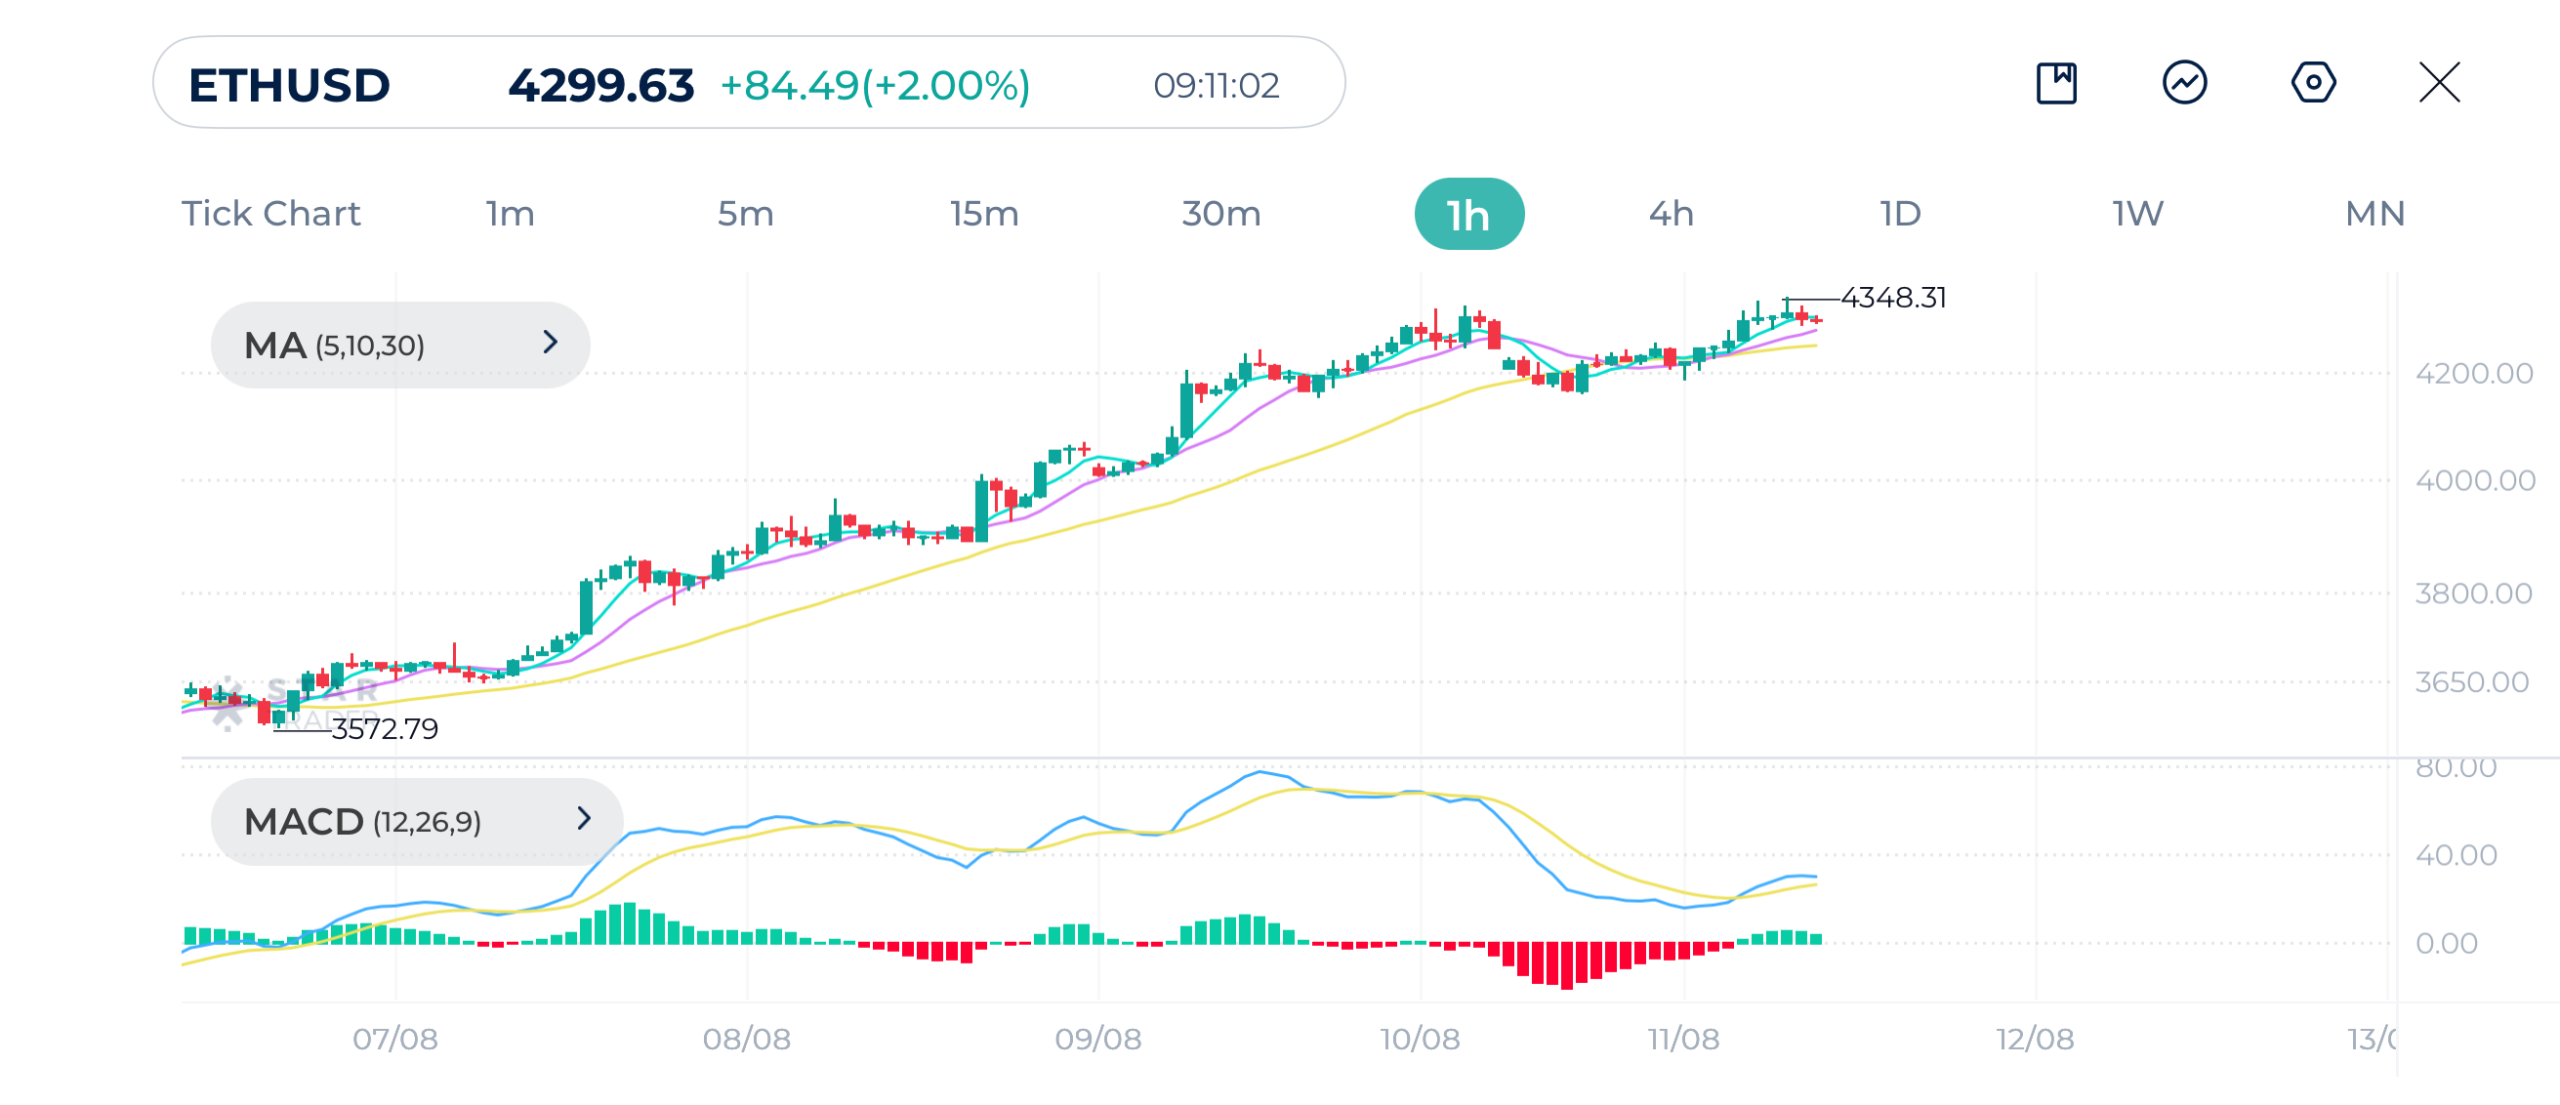
| Resistance | $4,349 | $4,375 | $4,400 |
| Support | $4,285 | $4,251 | $4,188 |
Gold Technical Analysis
Gold is currently trading at $3373, with the hourly chart showing a retracement from the recent swing high from last week. Price has broken below short-term moving averages (MA 5 and MA 10), and the MA 30 is now acting as a near-term resistance. The three moving averages show bearish alignment.
MACD is currently below zero level, with both the MACD line and the signal line trending downward, indicating bearish momentum. This downside move follows a failed attempt to sustain above the $3,400 level, which suggests that sellers have regained control in the short term.
Breaking below support level $3,349.92 could open the way for further declines.
Gold (XAUUSD) 1H Chart
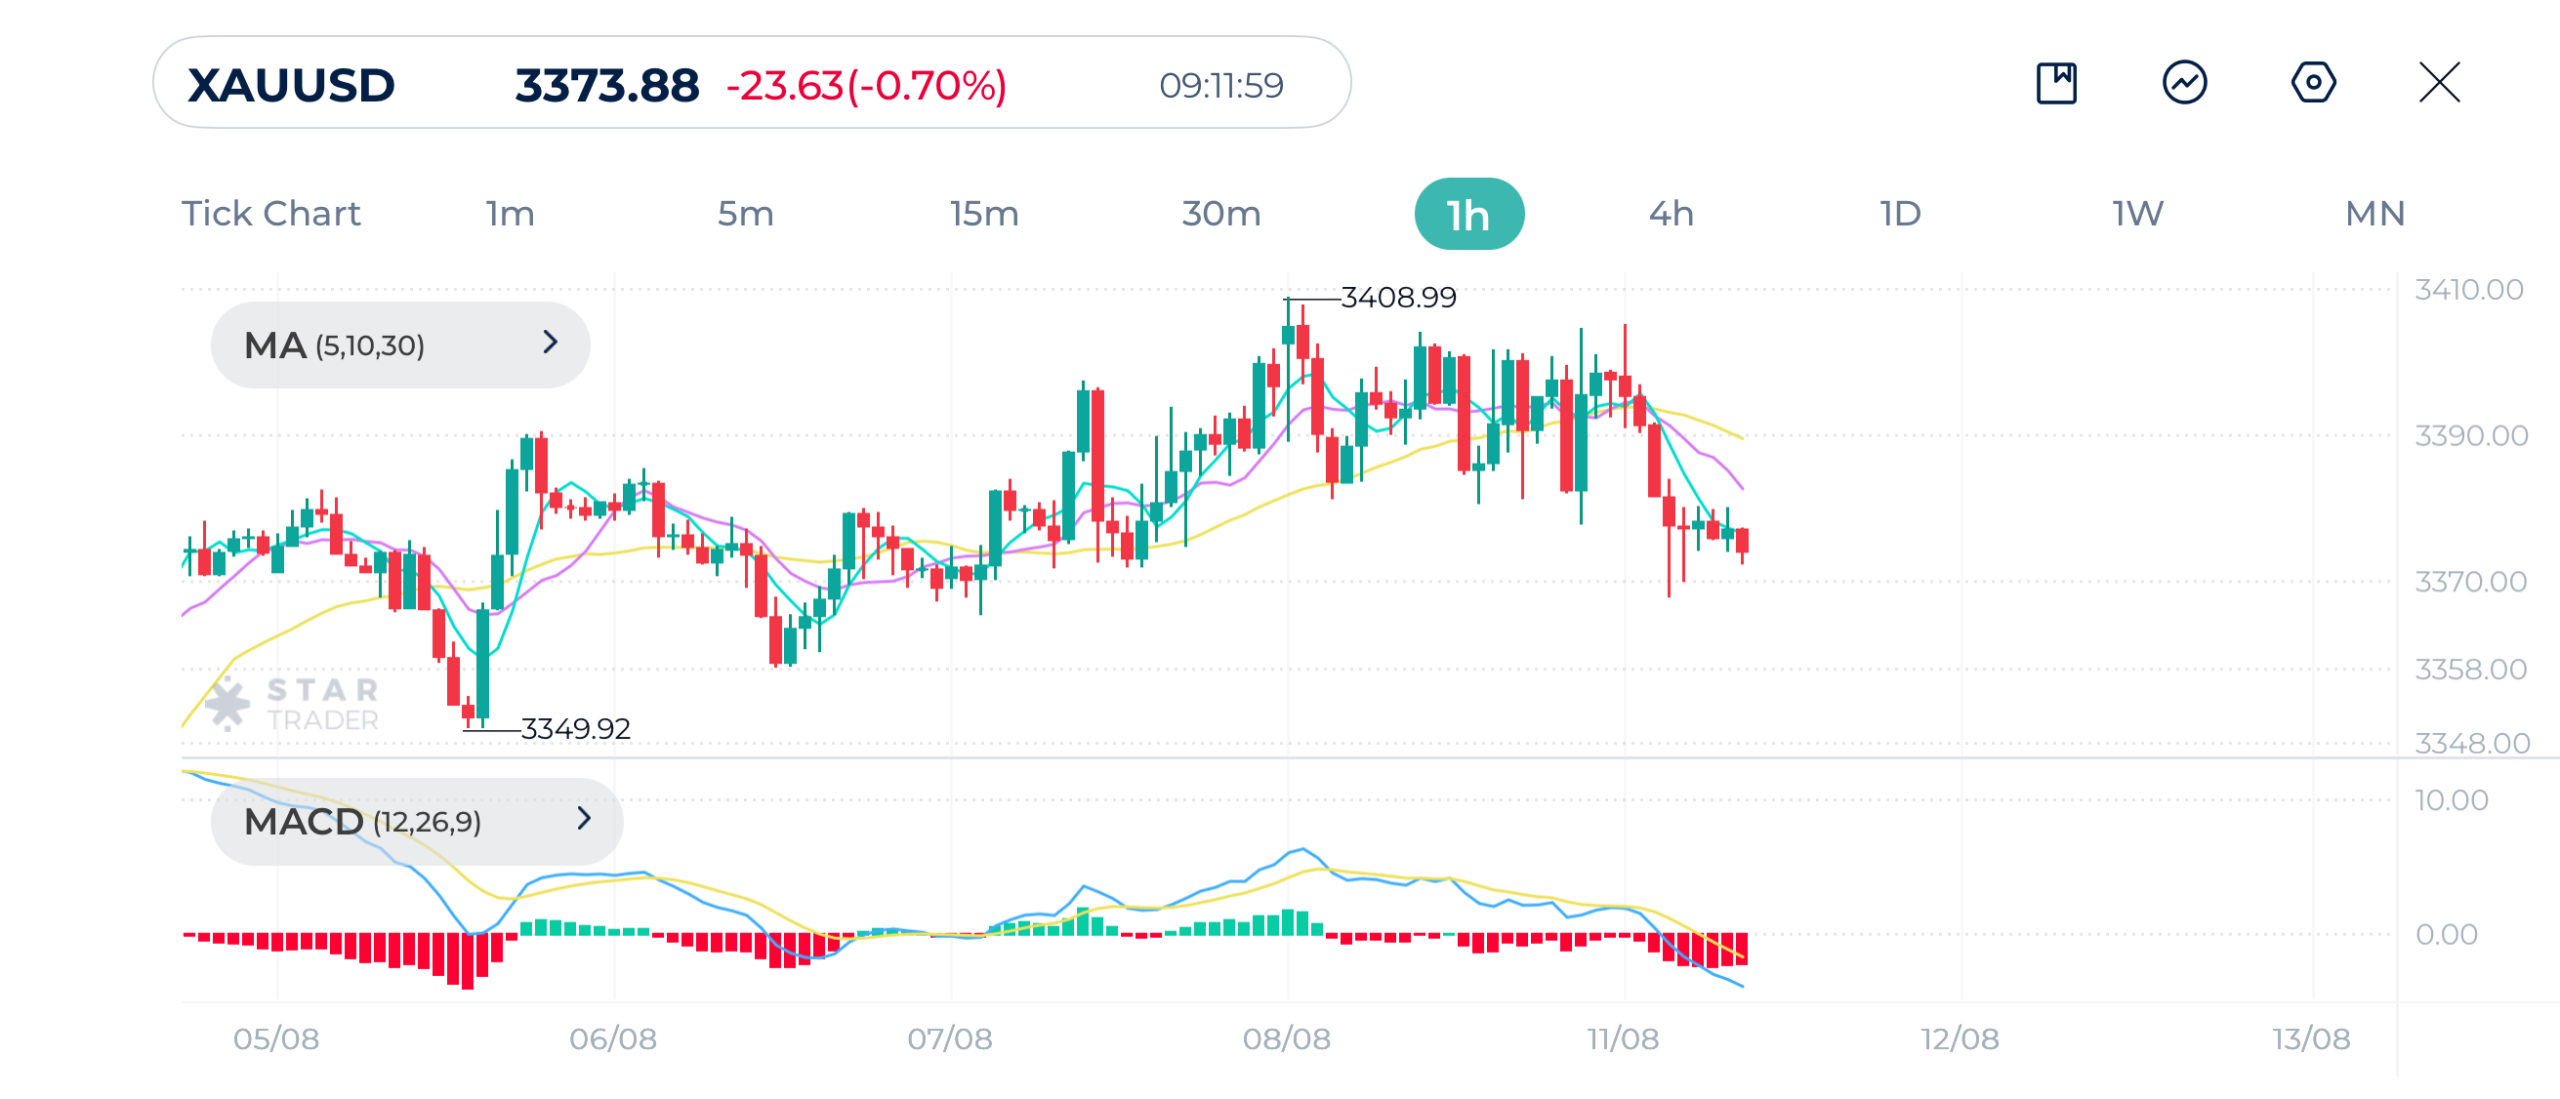
| Resistance | $3,390 | $3,410 | $3,425 |
| Support | $3,367 | $3,357 | $3,349 |
GBPUSD Technical Analysis
The British Pound is currently maintaining a strong bullish structure since bouncing from 1.3259 earlier in the week. The hourly chart shows higher highs and higher lows, and prices are moving above all three moving averages (MA 5, MA 10, and MA 30). This is a sign of healthy sustained buying pressure.
MACD is turning positive and trading above the zero level. Momentum remains strong, and the pair is heading towards 1.3500 psychological resistance level. A break above this could push price toward the next resistance zone near 1.3588
GBPUSD 1H Chart
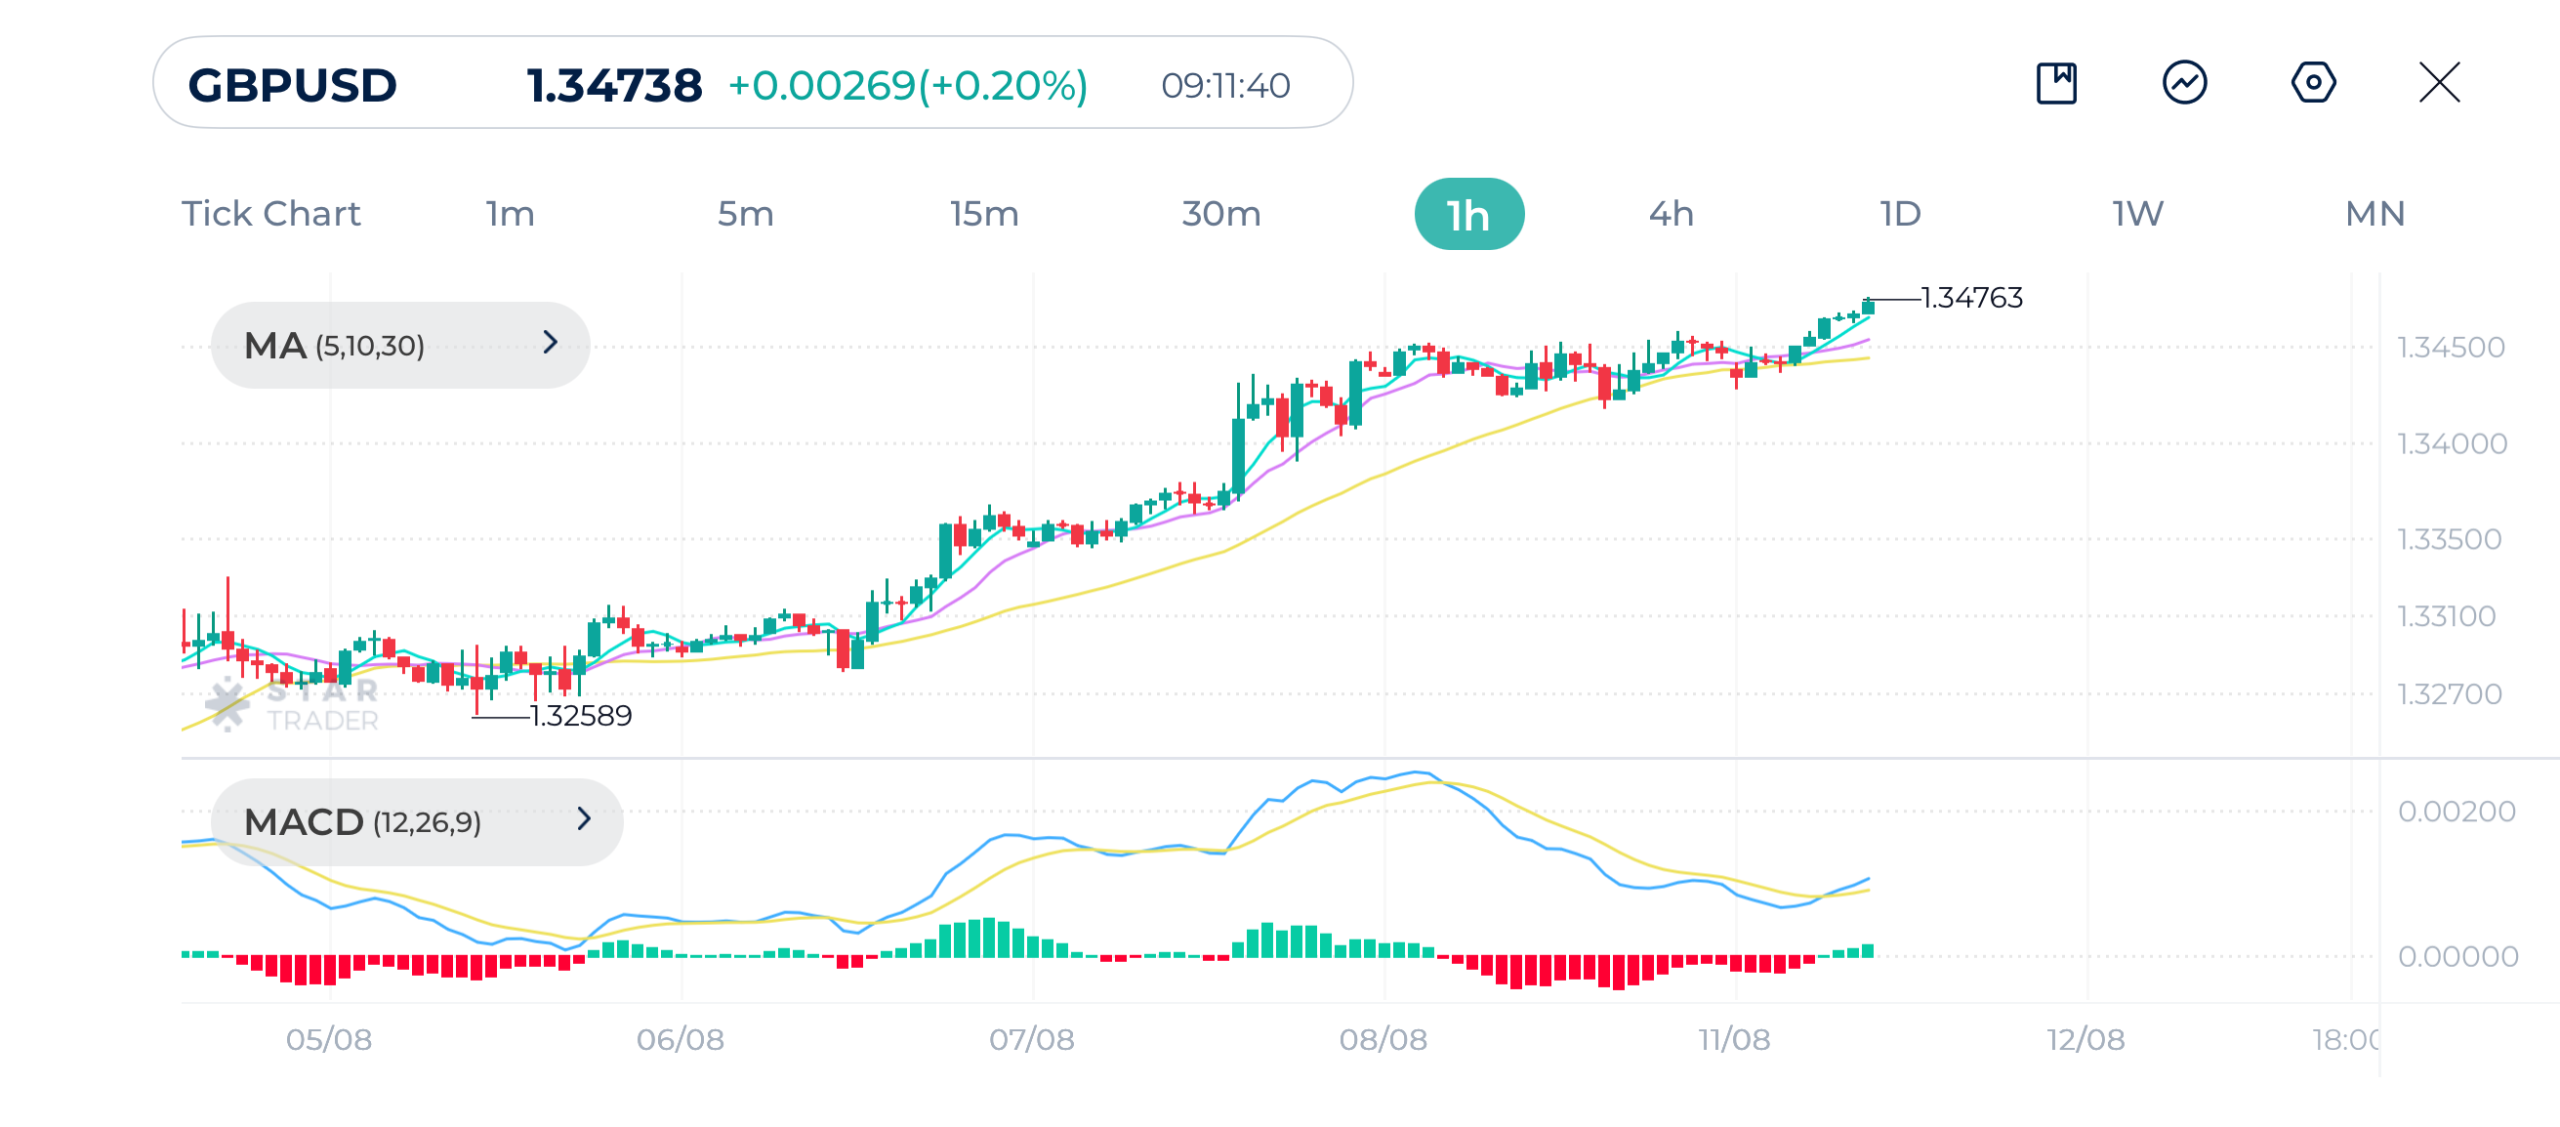
| Resistance | 1.3500 | 1.3547 | 1.3605 |
| Support | 1.3437 | 1.3418 | 1.3403 |
Tags
Open Live Account
Please enter a valid country
No results found
No results found
Please enter a valid email
Please enter a valid verification code
1. 8-16 characters + numbers (0-9) 2. blend of letters (A-Z, a-z) 3. special characters (e.g, !a#S%^&)
Please enter the correct format
Please tick the checkbox to proceed
Please tick the checkbox to proceed
Important Notice
STARTRADER does not accept any applications from Australian residents.
To comply with regulatory requirements, clicking the button will redirect you to the STARTRADER website operated by STARTRADER PRIME GLOBAL PTY LTD (ABN 65 156 005 668), an authorized Australian Financial Services Licence holder (AFSL no. 421210) regulated by the Australian Securities and Investments Commission.
CONTINUEImportant Notice for Residents of the United Arab Emirates
In alignment with local regulatory requirements, individuals residing in the United Arab Emirates are requested to proceed via our dedicated regional platform at startrader.ae, which is operated by STARTRADER Global Financial Consultation & Financial Analysis L.L.C.. This entity is licensed by the UAE Capital Market Authority (CMA) under License No. 20200000241, and is authorised to introduce financial services and promote financial products in the UAE.
Please click the "Continue" button below to be redirected.
CONTINUEError! Please try again.

