


Consumer price inflation, the more closely-watched inflation indicator today, is expected to show inflation remained near the 40-year highs it recorded last month.
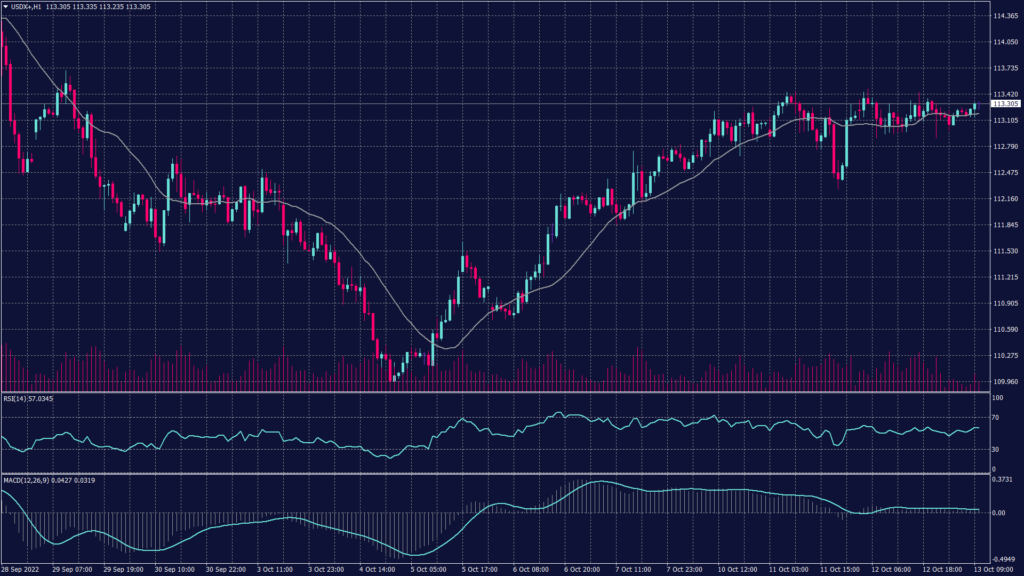
U.S. Dollar Index (USDX)
U.S. inflation data for September is also a key point of focus for metal markets this week. Producer price inflation data is due later on Wednesday and is expected to show that price headwinds for manufacturers persisted last month.
Consumer price inflation, the more closely-watched inflation gauge, is due on Thursday and is expected to show inflation remained pinned near 40-year highs last month. Both readings, coupled with strong jobs data last week, are expected to give the Fed enough impetus to keep raising interest rates at a sharp pace. However, weakening risk appetite pushed investors to the greenback, with the dollar largely overtaking the title of Safe-Haven.
Technically:
The index is trading at the resistance level of 113.25 which may cause a high level of volatility. However, there will be two scenarios at this level. The first one, if the index broke above 113.25 it will probably head towards 114 and 114.30. on the other hand, if the index failed to penetrate the resistance, it might head towards 112 in the short run. However, the daily chart remains positive as long as the index is trading above 109.60.
Pivot Point: 113.25
| SUPPORT | RESISTANCE |
| 113.10 | 113.60 |
| 112.50 | 113.80 |
| 112.30 | 114.70 |
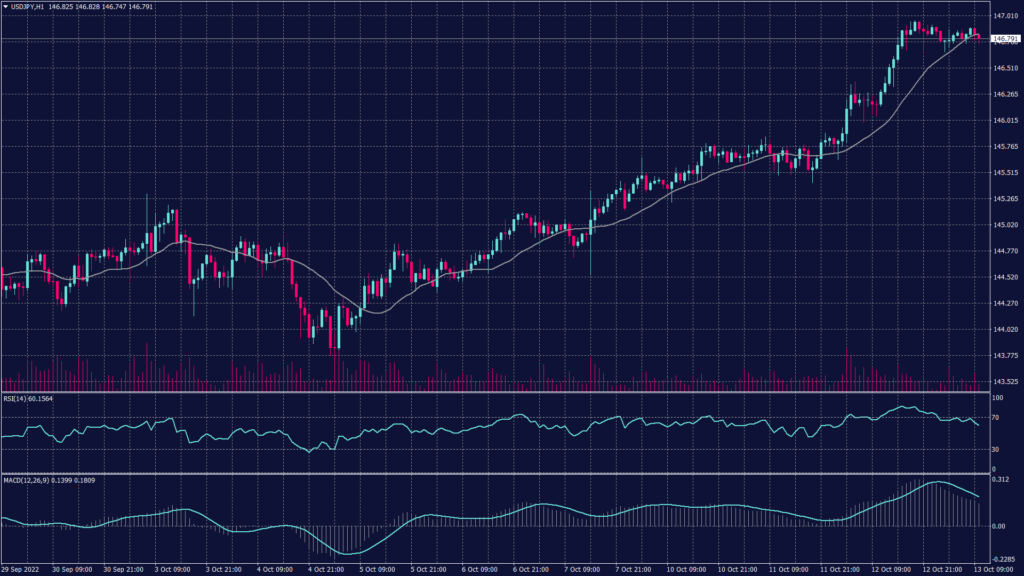
Japanese Yen (USDJPY)
Investors were cautious ahead of a key inflation reading in the U.S. later in the day for possible clues on how much higher the Federal Reserve will push interest rates.
The samurai currency is slightly away from its August 1998 low of 147.64, and well past last month’s low of 145.90 per dollar which prompted Japanese authorities to intervene to buy the yen. The yen hit a trough of 146.98 per dollar overnight and last traded at 146.87 during the early trades.
Technically:
The pair remains on the uptrend on the daily chart while technical indicators are softening and preparing for a momentum jump. However, despite the negative slope in the MACD lines, they signal a possibility of a continuation towards 147.50. On the other hand, RSI readings are at 70 this morning but price action is giving different signals.
Meanwhile, the hourly chart shows a slowdown in the uptrend momentum and signals a cruising around 146.80. However, RSI and MACD show a negative slope which indicates higher volatility and a possibility of a slight decline to 146.10.
Pivot Point: 146.80
| SUPPORT | RESISTANCE |
| 146.50 | 146.95 |
| 146.10 | 147.20 |
| 145.20 | 147.50 |
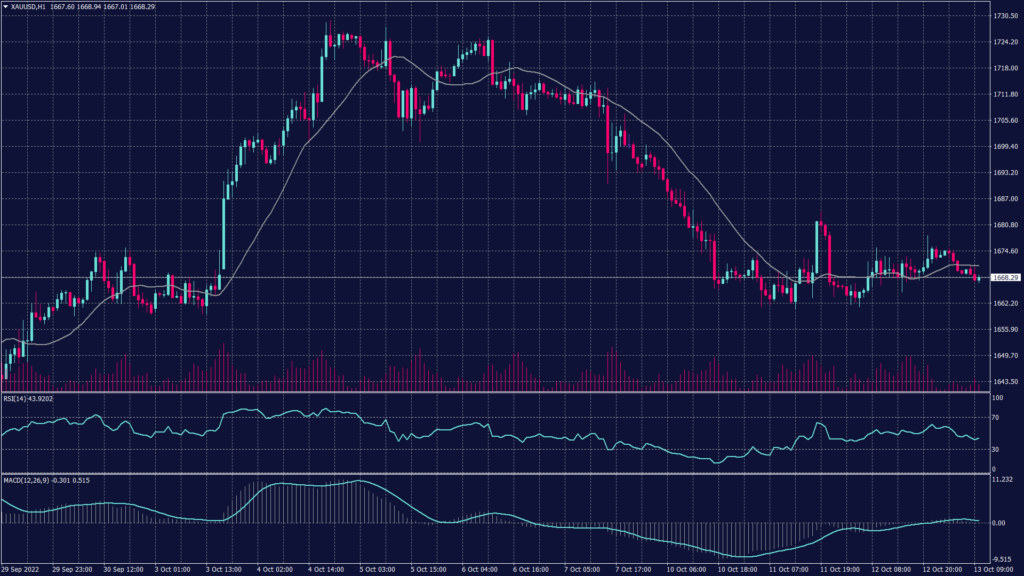
Spot Gold (XAUUSD)
The focus of this week is mainly on the U.S. CPI inflation data, which is due later today. The reading is expected to show that U.S. inflation remained stubbornly high in September, giving the Fed more impetus to keep raising interest rates. The minutes of the Fed’s September meeting also showed that the Fed has no plans to soften its hawkish stance.
Technically:
Gold prices are heading downwards on the hourly chart reaching the support at $1,665 per ounce. However, the current support is not strong enough to hold against the current selling pressure which might break the supports at 1,665 and 1,659 to head towards 1,650.
Meanwhile, the daily chart remains within the downtrend channel heading towards 1,620 on the foreseen time frame.
Pivot Point: 1,670
| SUPPORT | RESISTANCE |
| 1,659 | 1,675 |
| 1,650 | 1,680 |
| 1,640 | 1,690 |
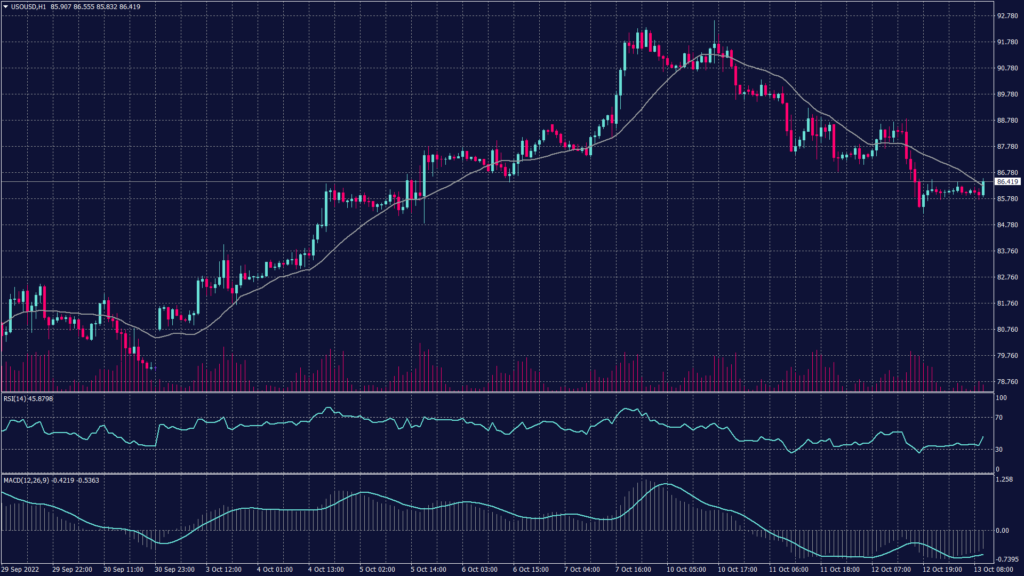
West Texas Crude (USOUSD)
Oil prices moved little on Thursday, keeping to their weekly lows as markets hunched down before key U.S. inflation data due later in the day, while a worsening outlook for crude demand kept sentiment muted.
Brent futures rose 0.1% to $92.65 a barrel, while WTI futures gained 0.1% to $87.32 a barrel. However, both contracts are down nearly 6% this week amid hawkish signals from the Federal Reserve.
Fears of weakening demand chipped away at prices, as a resurgence in Chinese COVID infections saw investors fearing new lockdowns in the world’s largest crude importer. Chinese trade and inflation data on Friday is expected to provide more cues on this front.
Technically:
The WTI chart shows a downward trend on the daily chart while trading right above the support at 86.60. However, the technical indicators show a chance of fluctuations between 85.60 and 87.40 before deciding the actual trend.
The hourly chart on the other hand is moving below the 20 and 50 periods moving average which indicates a high possibility of a negative trend continuation.
Pivot Point: 86.60
| SUPPORT | RESISTANCE |
| 86.30 | 89.30 |
| 84.85 | 90.80 |
| 83.40 | 92.25 |
Tags
Open Live Account
Please enter a valid country
No results found
No results found
Please enter a valid email
Please enter a valid verification code
1. 8-16 characters + numbers (0-9) 2. blend of letters (A-Z, a-z) 3. special characters (e.g, !a#S%^&)
Please enter the correct format
Please tick the checkbox to proceed
Please tick the checkbox to proceed
Important Notice
STARTRADER does not accept any applications from Australian residents.
To comply with regulatory requirements, clicking the button will redirect you to the STARTRADER website operated by STARTRADER PRIME GLOBAL PTY LTD (ABN 65 156 005 668), an authorized Australian Financial Services Licence holder (AFSL no. 421210) regulated by the Australian Securities and Investments Commission.
CONTINUEImportant Notice for Residents of the United Arab Emirates
In alignment with local regulatory requirements, individuals residing in the United Arab Emirates are requested to proceed via our dedicated regional platform at startrader.ae, which is operated by STARTRADER Global Financial Consultation & Financial Analysis L.L.C.. This entity is licensed by the UAE Capital Market Authority (CMA) under License No. 20200000241, and is authorised to introduce financial services and promote financial products in the UAE.
Please click the "Continue" button below to be redirected.
CONTINUEError! Please try again.

