


U.S. Dollar Index (USDX)
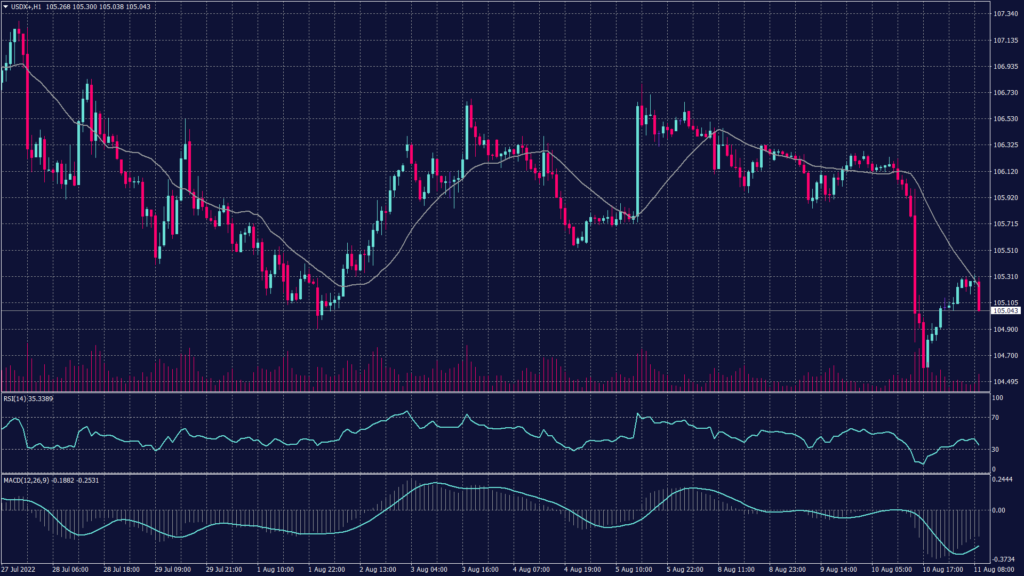
The weak dollar was the clincher for those seeking advance in the market while the Dollar Index hit a one-month low of 104.51. The dollar tumbled after the Labour Department reported that the Consumer Price Index rose by 8.5% during the year to July versus a 9.1% annual expansion in June that marked its most in 41 years.
Economists polled by U.S. media had expected an 8.7% growth in the annual CPI reading for last month. The index posted zero growth in July, versus an expansion of 1.3% in June.
Technically:
The U.S. dollar index declined sharply yesterday breaking the support at 105.00 on the daily time frame. Meanwhile, the index remains to hold to the uptrend on the daily chart as long as it is trading above 103.80. The index is not seen changing the trend direction unless it traded below 103.80 which is technically far target.
However, on the hourly chart, the index might slide further down towards 104.30 if it declined below 104.90. Technical indicators show a possibility for fluctuation and a chance to trade below 105.90 for a short while.
PIVOT POINT: 105.00
| SUPPORT | RESISTANCE |
| 104.90 | 105.60 |
| 104.30 | 106.00 |
| 103.80 | 106.25 |
Euro (EURUSD)
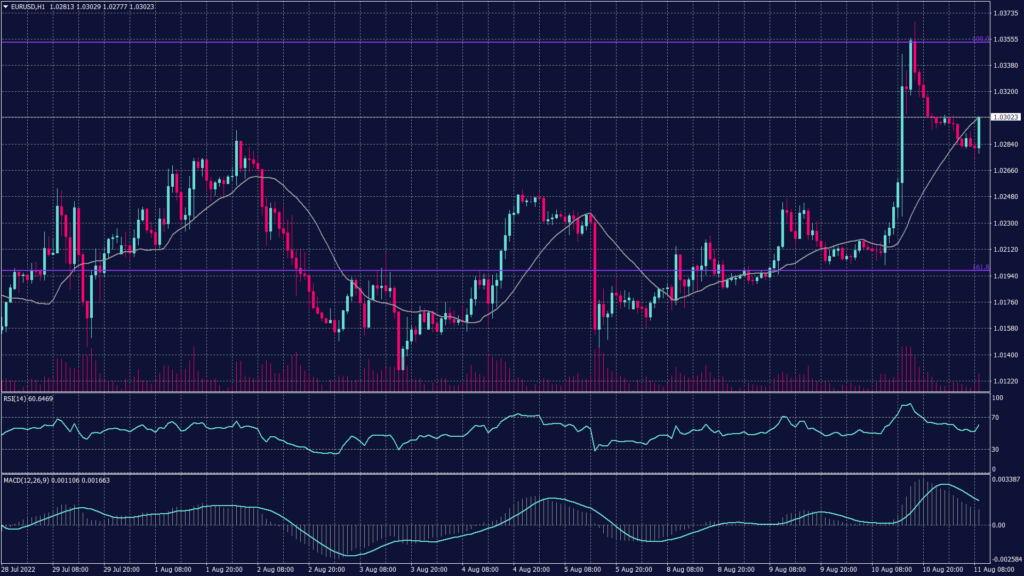
The common currency traded higher yesterday and declined this morning after U.S. inflation data overnight came in less hot than feared and sent the dollar tumbling. Meanwhile, the euro was at $1.0297 on Thursday morning, after jumping 0.84% the day before, its biggest daily percentage gain since mid-June.
The EURUSD pair declined today from its 1-month high but remains green on the daily chart so far. However, the hourly chart fluctuations seem to tend to push the pair up to yesterdays high after bouncing from 1.0280.
PIVOT POINT: 1.0320
| SUPPORT | RESISTANCE |
| 1.0300 | 1.0330 |
| 1.0280 | 1.0360 |
| 1.0220 | 1.0390 |
Spot Gold (XAUUSD)
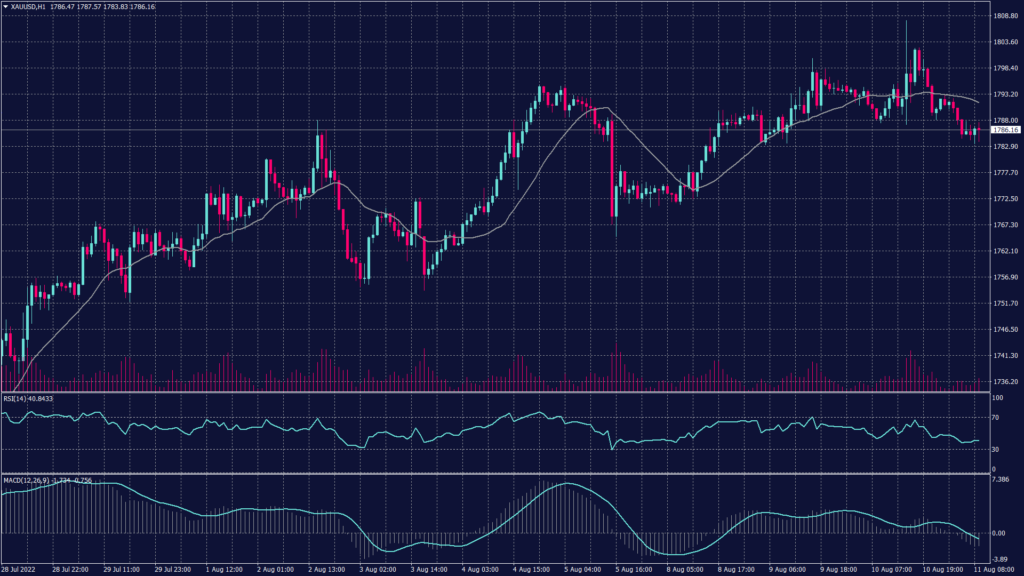
Gold prices slipped as recessionary fears were eased after the soft inflation data. However, gold prices had rallied to a one-month high yesterday after data showed that U.S. inflationary pressures easing. Spot gold fell 0.1% to $1,789.91, while gold futures were down 0.5% at $1,805.45.
Producer price inflation is expected to mirror a fall in consumer prices. But any signs that this trend did not extend to factory prices could dent risk appetite.
Technically:
The precious metal remains committed to the daily chart’s downtrend and will remain so unless it broke above the channel at 1,800. Meanwhile, the hourly chart shows slight support above 1,780 but remains to indicate a downward movement towards 1,770.
Technical indicators signal an intense fluctuation between 1,770 and 1,788 but both RSI and MACD support the theory of going back below 1,770.
PIVOT POINT: 1,790
| SUPPORT | RESISTANCE |
| 1,770 | 1,800 |
| 1,767 | 1,810 |
| 1,759 | 1,825 |
West Texas Crude (USOUSD)
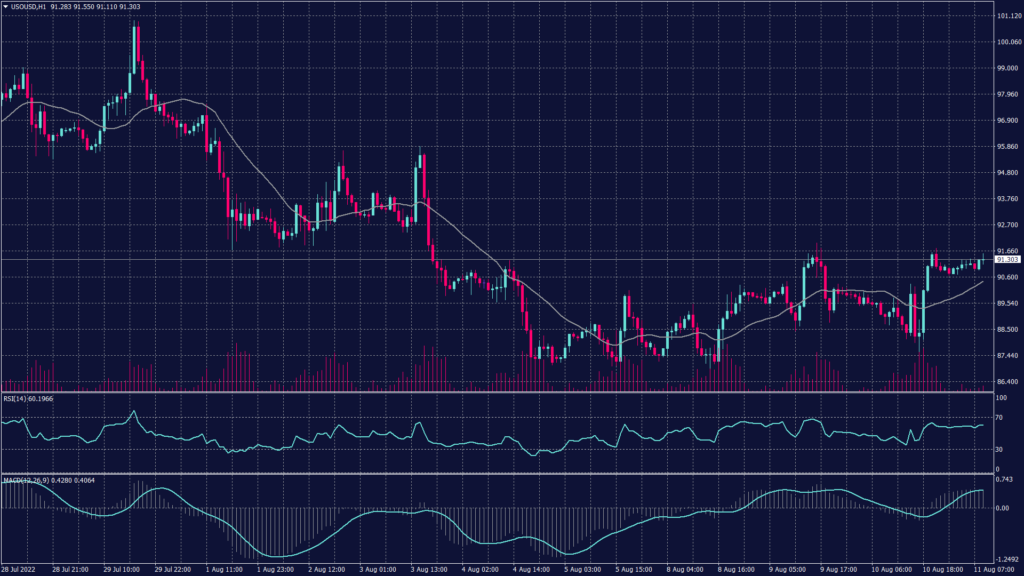
Crude advanced firmly above the $90 per barrel as traders are enjoying a lower inflation reading which dragged rate hike expectations and the dollar lower. The market went deeper into the red after the U.S. Energy Information Administration reported a second straight weekly build of five million barrels in crude balances.
WTI crude settled up 1.6% at $91.33 per barrel, while Brent settled up 1.1% at $97.40. Both WTI and Brent were up about 3% on the week after last week’s slump that wiped 10% off the U.S. benchmark and nearly 14% off the London-based crude gauge.
WTI is moving higher on the daily candle but remains in the declining despite the bounce from the support at $87.50 per barrel. However, WTI is expected to break the support of 87.50 towards $85 a barrel.
PIVOT POINT: 91.10
| SUPPORT | RESISTANCE |
| 87.50 | 92.50 |
| 86.40 | 92.75 |
| 85.00 | 93.80 |
Tags
Open Live Account
Please enter a valid country
No results found
No results found
Please enter a valid email
Please enter a valid verification code
1. 8-16 characters + numbers (0-9) 2. blend of letters (A-Z, a-z) 3. special characters (e.g, !a#S%^&)
Please enter the correct format
Please tick the checkbox to proceed
Please tick the checkbox to proceed
Important Notice
STARTRADER does not accept any applications from Australian residents.
To comply with regulatory requirements, clicking the button will redirect you to the STARTRADER website operated by STARTRADER PRIME GLOBAL PTY LTD (ABN 65 156 005 668), an authorized Australian Financial Services Licence holder (AFSL no. 421210) regulated by the Australian Securities and Investments Commission.
CONTINUEImportant Notice for Residents of the United Arab Emirates
In alignment with local regulatory requirements, individuals residing in the United Arab Emirates are requested to proceed via our dedicated regional platform at startrader.ae, which is operated by STARTRADER Global Financial Consultation & Financial Analysis L.L.C.. This entity is licensed by the UAE Capital Market Authority (CMA) under License No. 20200000241, and is authorised to introduce financial services and promote financial products in the UAE.
Please click the "Continue" button below to be redirected.
CONTINUEError! Please try again.

