








 Web Trader MT5









Silver Technical Analysis
Silver is under heavy short term bearish pressure after failing to sustain gains above the $90–$92 zone and experiencing a sharp breakdown that accelerated losses toward the $73.00 area
Price is trading well below all key moving averages, with the 30-period moving average acting as dynamic resistance.
As long as price remains below the $82–$84 resistance zone, the risk remains tilted to the downside, with further pressure possible toward the low 70s if selling resumes. A sustained reclaim of the 30-period moving average would be required to shift the short-term bias toward neutral.
Silver 1H Chart
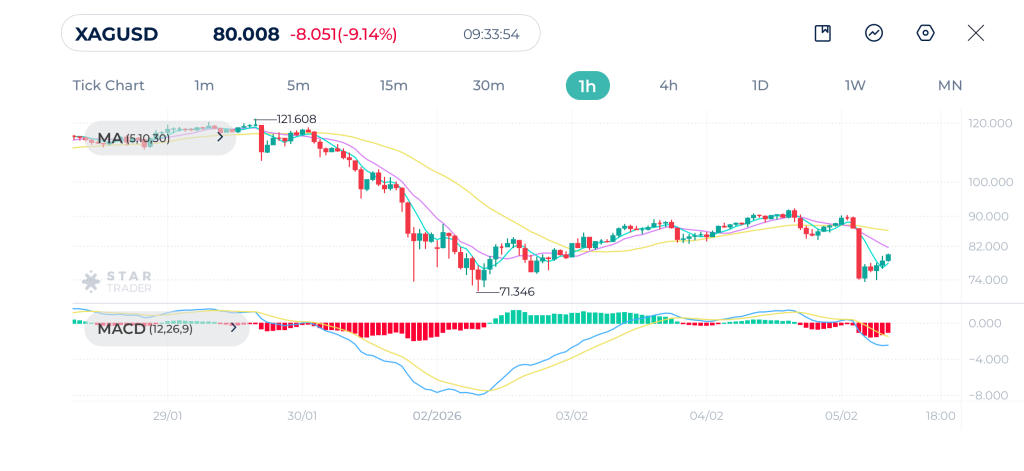
| Resistance | $82.86 | $87.67 | $92.21 |
| Support | $73.56 | $71.20 | $70.46 |
S&P 500 Technical Analysis
The S&P 500 is currently in a choppy corrective phase following the rejection from the 7,017 resistance area. The moving averages reflect this uncertainty, with the short term moving averages MA(5) and MA(10) frequently crossing each other and price oscillating around the 30-period moving average.
MACD has recently recovered from negative territory but remains relatively muted.
As long as price holds above the 6,840 support zone, deeper downside risk remains limited, but upside progress is capped below 7,000–7,020 unless momentum expands again. A clean break and hold above 7,020 would restore bullish continuation, while a breakdown below 6,840 would open the door for a deeper corrective leg.
S&P 500 1H Chart
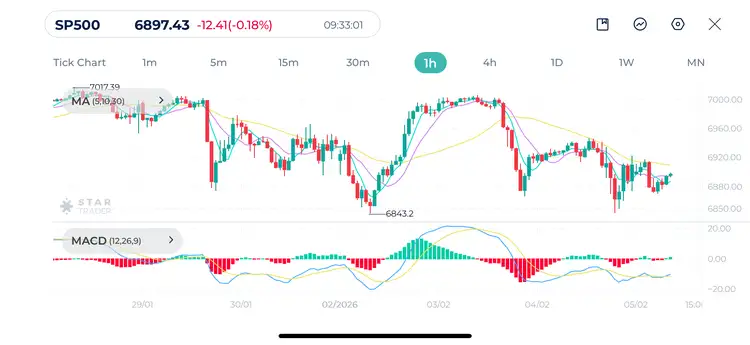
| Resistance | 6,908 | 6,919 | 6,946 |
| Support | 6,865 | 6,848 | 6,779 |
Bitcoin Technical Analysis
Bitcoin remains clearly bearish on the daily and 1H timeframes, with price continuing to trade within a well-defined descending structure. The failure near the $84,000–$85,000 region marked a clear distribution phase, followed by successive breakdowns that pushed price toward the $70,000–$71,000 area.
All short-term moving averages are aligned bearishly. MACD remains deeply negative, indicating that bearish momentum is still dominant. While price is attempting to stabilize near the $70,000 psychological level, the lack of strong bullish candles suggests this is merely consolidation.
As long as bitcoin remains below the $74,000–$75,000 resistance zone, rallies are likely to be limited. A decisive breakdown below $70,000 would expose further downside toward $65,000, while only a reclaim of the 30-period moving average would signal a potential shift toward neutral conditions.
Bitcoin 1H Chart
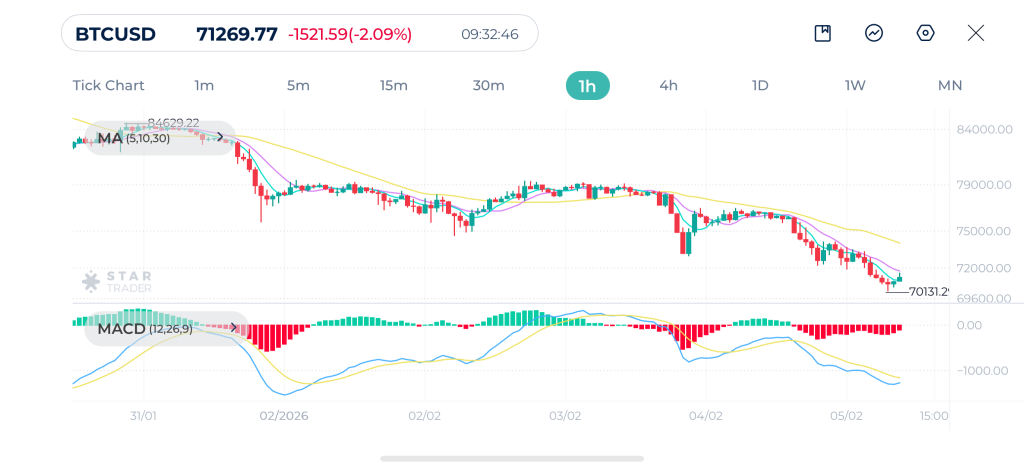
| Resistance | $71,849 | $74,074 | $75,186 |
| Support | $70,047 | $69,834 | $67,265 |
Tags


Open Live Account
 Email Address
 Phone Number
Important Notice
STARTRADER does not accept any applications from Australian residents.
To comply with regulatory requirements, clicking the button will redirect you to the STARTRADER website operated by STARTRADER PRIME GLOBAL PTY LTD (ABN 65 156 005 668), an authorized Australian Financial Services Licence holder (AFSL no. 421210) regulated by the Australian Securities and Investments Commission.
Important Notice for Residents of the United Arab Emirates
In alignment with local regulatory requirements, individuals residing in the United Arab Emirates are requested to proceed via our dedicated regional platform at startrader.ae, which is operated by STARTRADER Global Financial Consultation & Financial Analysis L.L.C.. This entity is licensed by the UAE Capital Market Authority (CMA) under License No. 20200000241, and is authorised to introduce financial services and promote financial products in the UAE.
Please click the "Continue" button below to be redirected.


