


Silver Technical Analysis
On the 1H timeframe, silver is exhibiting a powerful and aggressive bullish trend. The price action is currently parabolic, as it reached $91.21, representing a substantial 4% gain so far today. The steep upward slope of the Moving Averages suggests that buyers are in control, and the price remains well extended above the 30-period moving average, indicating high momentum. MACD supports this bullish outlook, as it has recently crossed above the zero line.
While the trend is exceptionally strong, the vertical nature of the move suggests the market is nearing overbought territory, making the previous consolidation zone at $88.00 a critical level of support in the event of a retracement.
Silver 1H Chart
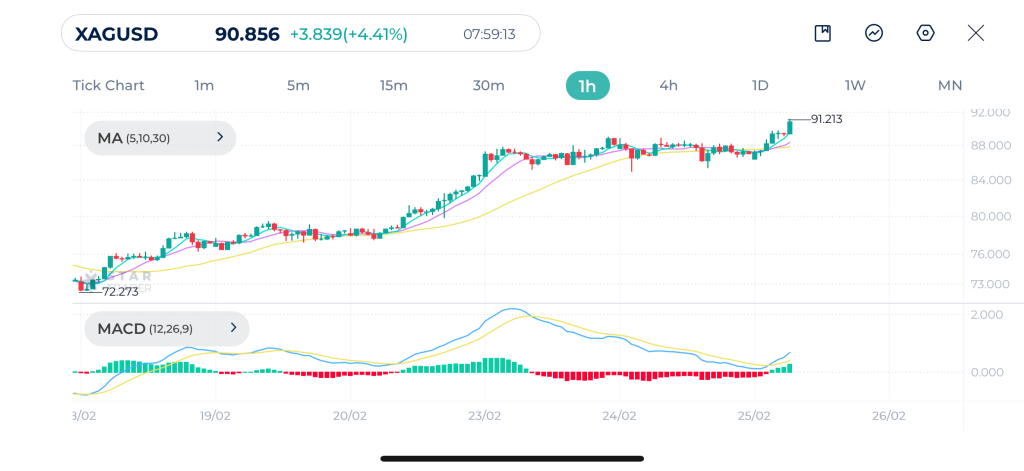
| Resistance | $91.50 | $92.24 | $94.10 |
| Support | $89.09 | $87.94 | $86.46 |
Brent Technical Analysis
On the 1H timeframe, Brent is currently showing price in consolidation phase. Following a sustained bullish expansion that peaked near the$ 72 level on Monday, the price action has flattened significantly. Price is currently oscillating tightly around the 5, 10, and 30-period Moving Averages, indicating a temporary equilibrium between buyers and sellers.
This lack of clear direction is further confirmed by the MACD indicator. Both the MACD and signal lines are virtually flat around the zero line. For the uptrend to continue, price needs to decisively break above the recent resistance at $72.55. On the downside, a break below $70 could drag price further toward the previous major support of $67.
Brent 1H Chart
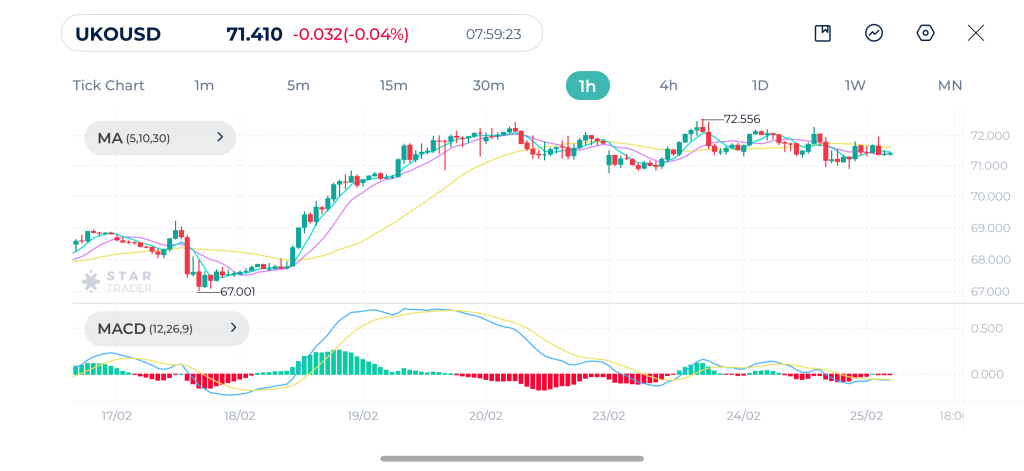
| Resistance | $71.53 | $72.12 | $73.00 |
| Support | $70.51 | $70.00 | $69.39 |
USDJPY Technical Analysis
USDJPY is currently experiencing a short term corrective pullback after failing to sustain its climb above the 156.27 mark from yesterday’s session. Price has recently broken below the shorter term moving averages and is now testing the yellow 30-period moving average for support. This shift in sentiment is reflected in the MACD, where a bearish crossover occurred during the Asian session.
If the current price of 155.60 fails to hold, the pair may slide further to test the psychological support level at 155.00. On the other hand, a break above 156.27 recent resistance could push the pair higher.
USDJPY 1H Chart
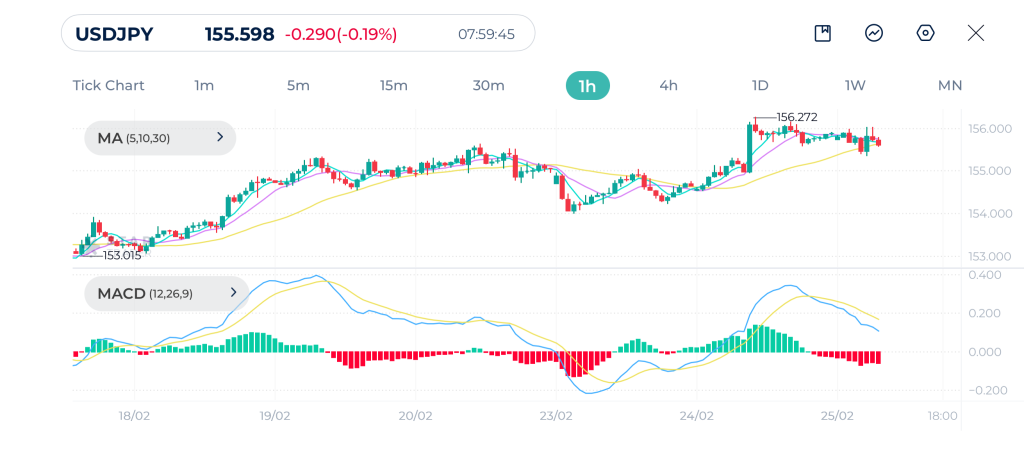
| Resistance | 156.04 | 156.28 | 157.24 |
| Support | 155.35 | 154.97 | 154.21 |
Tags
Open Live Account
Please enter a valid country
No results found
No results found
Please enter a valid email
Please enter a valid verification code
1. 8-16 characters + numbers (0-9) 2. blend of letters (A-Z, a-z) 3. special characters (e.g, !a#S%^&)
Please enter the correct format
Please tick the checkbox to proceed
Please tick the checkbox to proceed
Important Notice
STARTRADER does not accept any applications from Australian residents.
To comply with regulatory requirements, clicking the button will redirect you to the STARTRADER website operated by STARTRADER PRIME GLOBAL PTY LTD (ABN 65 156 005 668), an authorized Australian Financial Services Licence holder (AFSL no. 421210) regulated by the Australian Securities and Investments Commission.
CONTINUEImportant Notice for Residents of the United Arab Emirates
In alignment with local regulatory requirements, individuals residing in the United Arab Emirates are requested to proceed via our dedicated regional platform at startrader.ae, which is operated by STARTRADER Global Financial Consultation & Financial Analysis L.L.C.. This entity is licensed by the UAE Capital Market Authority (CMA) under License No. 20200000241, and is authorised to introduce financial services and promote financial products in the UAE.
Please click the "Continue" button below to be redirected.
CONTINUEError! Please try again.

