








 Web Trader MT5









Dow Jones Technical Analysis
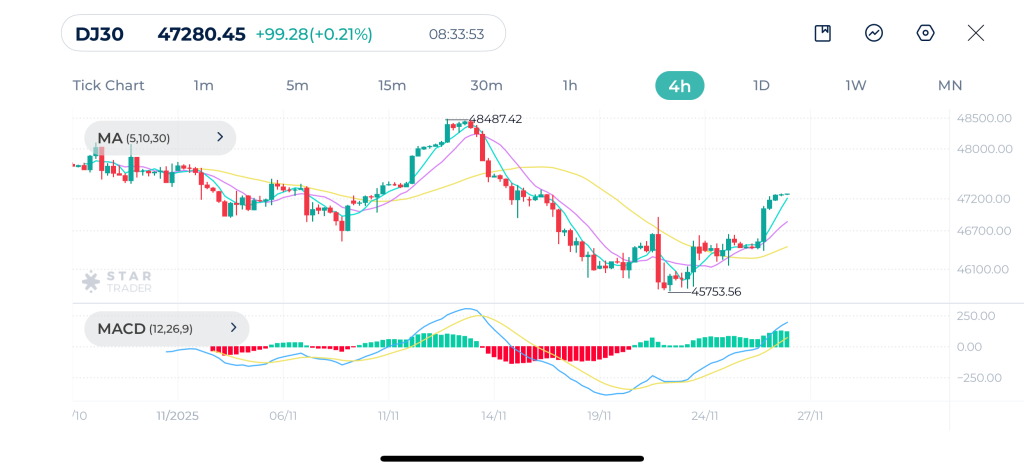
The Dow Jones is showing a strong bullish recovery after the strong sell-off earlier this month. Price has recently shown a clean reversal signal, a strong bullish impulse, a break above the short term moving averages, and then a continuation move where all three moving averages MA(5, 10, and 30) are now aligned to the upside. This alignment suggests that momentum is shifting firmly back in favor of buyers.
MACD confirms the shift in momentum, and the MACD line has crossed above the signal line with widening distance.
Price is now approaching a minor resistance zone, just below 47,300–47,500. A clean break above this region could open the door for a move back toward 48,000+. If there is a pullback, support should appear around 46,700–46,900, which is where the short-term moving averages are currently clustering.
Dow Jones 4H Chart
| Resistance | 47,411 | 47,455 | 47,727 |
| Support | 46,859 | 46,587 | 46,319 |
Bitcoin Technical Analysis
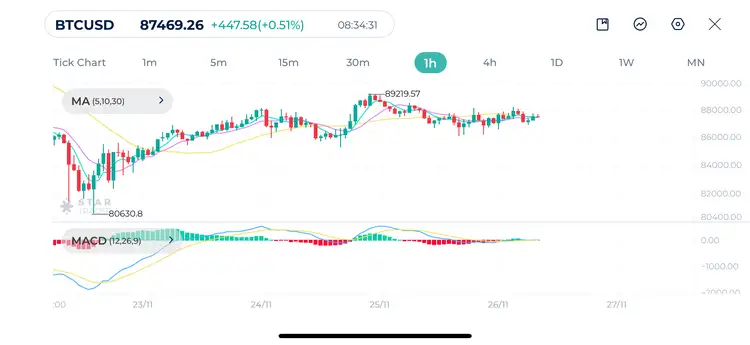
Bitcoin is moving in a clear consolidation phase after the sharp declines earlier this month. The short term moving averages MA(5) and MA(10) are crossing frequently and flattening out, showing a loss of trend strength.
MACD is barely expanding, with very small bars on both sides, and the MACD and signal lines are almost overlapping, which is a classic sign of low volatility and absence of strong trend pressure.
As long as Bitcoin stays above the short-term support near $87,000, the bullish structure remains intact, but a breakout above $88,500–$89,000 is needed to restart the upward trend. On the downside, losing $86,500 would indicate the beginning of a deeper correction.
Bitcoin 1H Chart
| Resistance | $88,163 | $88,464 | $89,216 |
| Support | $86,872 | $86,132 | $85,305 |
AUDUSD Technical Analysis
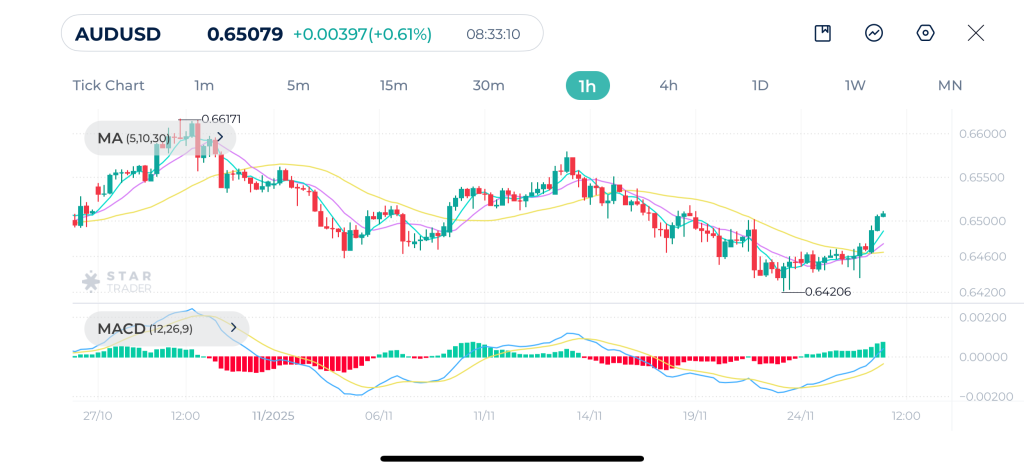
AUDUSD is showing a clear bullish reversal structure, driven by a strong bounce from the recent low at 0.6420. The pair has shifted from a declining trend into a new upward momentum phase. Price has climbed above all three moving averages. MA(5) and MA(10) have both crossed above the 30-period moving average, signaling a short-term trend reversal.
MACD behavior confirms the strength of the move. After a prolonged period of red histogram bars, momentum has flipped sharply into green with strong expansion. The MACD line is crossing aggressively above the signal line, indicating that buyers have taken control convincingly.
If AUDUSD maintains its position above 0.6480–0.6490, the next bullish target is 0.6530 followed by the previous swing high around 0.6617. If price pulls back, support is expected at 0.6455.
AUDUSD 1H Chart
| Resistance | 0.6512 | 0.6537 | 0.6558 |
| Support | 0.6490 | 0.6483 | 0.6469 |
Tags


Open Live Account
 Email Address
 Phone Number
Important Notice
STARTRADER does not accept any applications from Australian residents.
To comply with regulatory requirements, clicking the button will redirect you to the STARTRADER website operated by STARTRADER PRIME GLOBAL PTY LTD (ABN 65 156 005 668), an authorized Australian Financial Services Licence holder (AFSL no. 421210) regulated by the Australian Securities and Investments Commission.
Important Notice for Residents of the United Arab Emirates
In alignment with local regulatory requirements, individuals residing in the United Arab Emirates are requested to proceed via our dedicated regional platform at startrader.ae, which is operated by STARTRADER Global Financial Consultation & Financial Analysis L.L.C.. This entity is licensed by the UAE Capital Market Authority (CMA) under License No. 20200000241, and is authorised to introduce financial services and promote financial products in the UAE.
Please click the "Continue" button below to be redirected.


