








 Web Trader MT5











Gold Technical Analysis
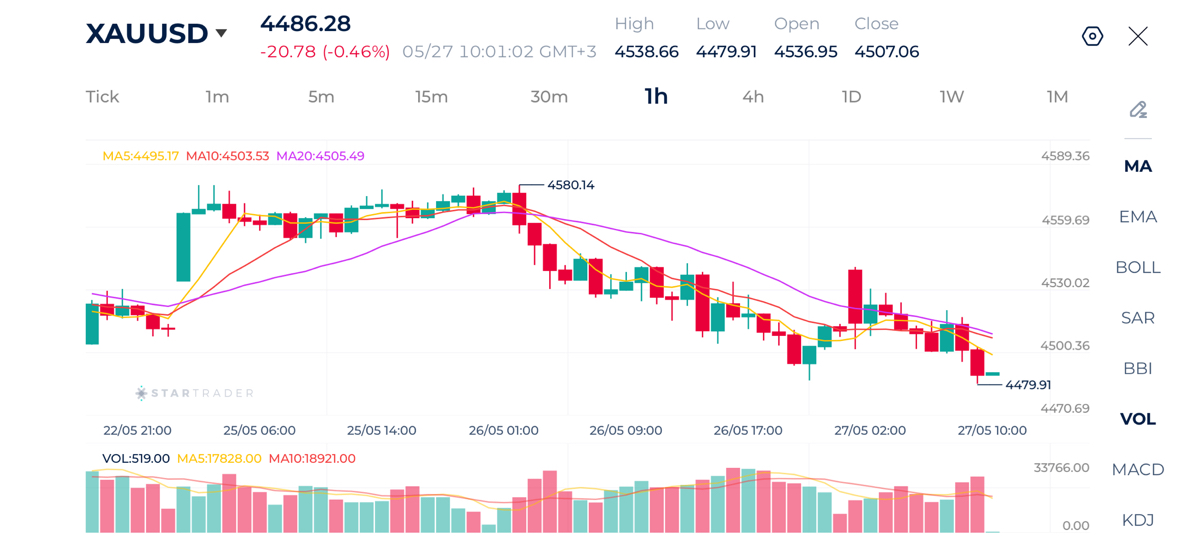
The hourly chart on gold shows sustained downtrend characterized by consecutive lower highs and lower lows. Price is currently hovering near its recent low of $4,480.
All major moving averages (MA5, MA10, MA20) are currently sloping downwards, indicating strong bearish control.
If price breaks below the immediate support level $4,480, we can see a continuation downward toward the next psychological support level $4,450.
However, for a reversal to occur, buyers need to push the price back above the dynamic resistance of the MA10 and MA20. Until then, any upward movement is considered a minor retracement within a dominant downtrend.
Gold 1H Chart
| Resistance | $4,530 | $4,560 | $4,580 |
| Support | $4,480 | $4,450 | $4,400 |
Brent Technical Analysis
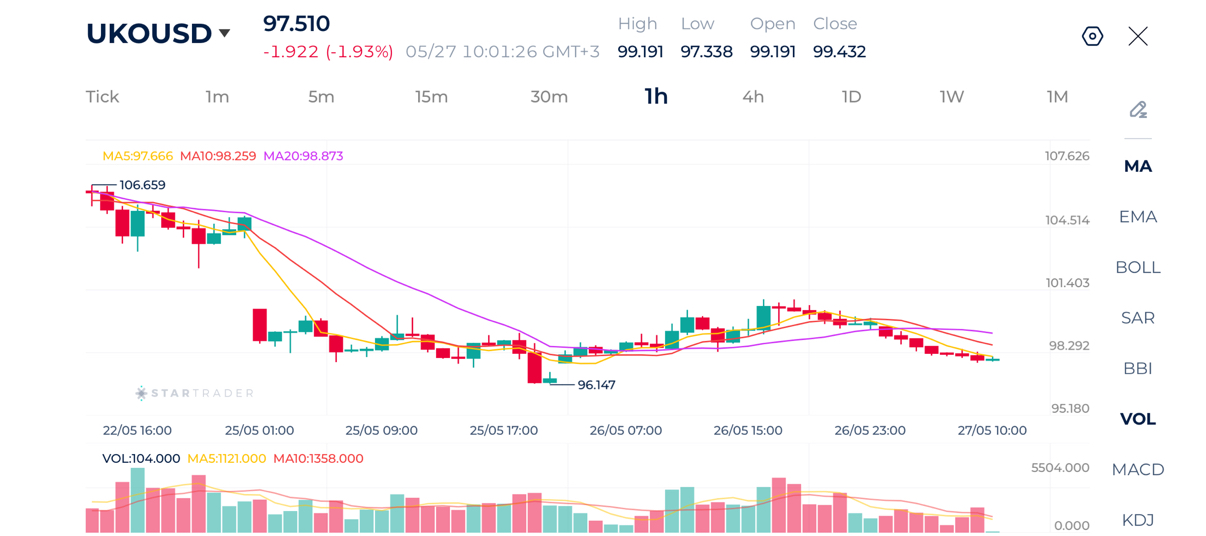
Oil prices have experienced a steep sell-off from the recent high of $106.65 reaching $96.14. Following the sell-off, the price moved sideways into a tight consolidation channel between roughly $96.15 and $99.50.
Because the market is strictly consolidating, directional bias is neutral until a boundary is broken.
A breakdown below the $96.14 support will indicate a possible continuation of the macro downtrend, likely to the $95.00 psychological level.
However, a breakout above of the resistance $level $99.20 could trigger a short-covering rally back up toward the $101.40 level.
Brent 1H Chart
| Resistance | $99.40 | $101.65 | $104.00 |
| Support | $95.42 | $93.47 | $91.20 |
EURUSD Technical Analysis
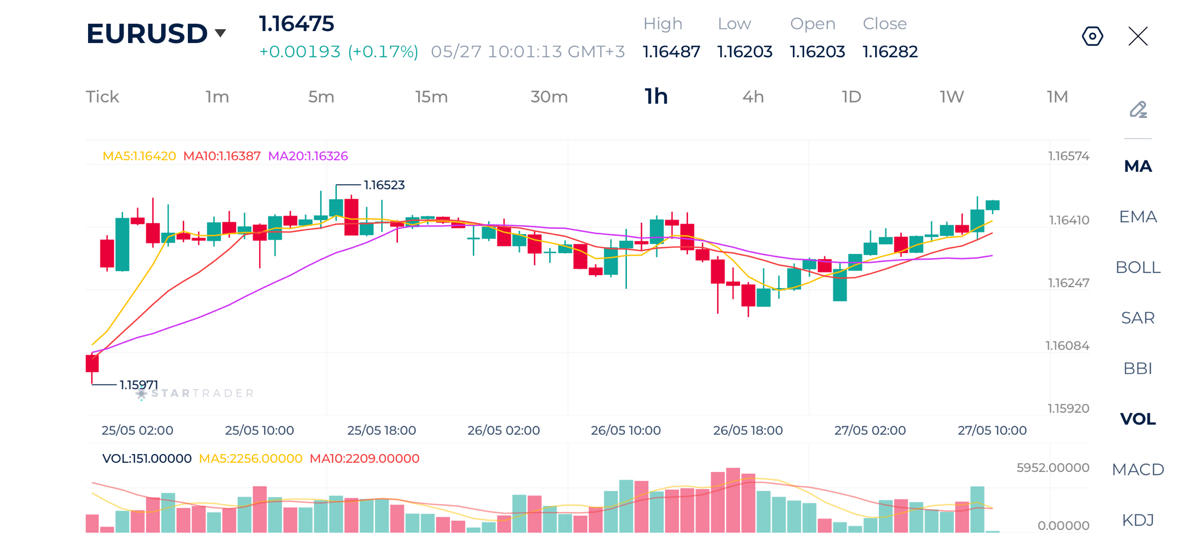
After a correction that bottomed out around 1.1620 yesterday, EURUSD formed a solid base and began establishing an ascending sequence of higher lows. The pair successfully crossed back above the MA20 moving average, shifting the short-term market structure from bearish to bullish. Buying volume spikes accompany the latest green candles, confirming buyer interest at these higher levels.
A clean break above 1.1655 opens the door for a move toward 1.1675.
If the key resistance at 1.1652 holds, we can expect a minor pullback to retest the moving average support levels around 1.16380 – 1.16420 before another potential leg up.
EURUSD 1H Chart
| Resistance | 1.1655 | 1.1675 | 1.1700 |
| Support | 1.1624 | 1.1600 | 1.1570 |
Risk Disclaimer: This material is provided for informational purposes only and does not constitute a recommendation or investment advice. Trading financial instruments on margin involves substantial risk and may not be appropriate for all investors.
Tags


Open Live Account
 Email Address
 Phone Number
Important Notice
STARTRADER does not accept any applications from Australian residents.
To comply with regulatory requirements, clicking the button will redirect you to the STARTRADER website operated by STARTRADER PRIME GLOBAL PTY LTD (ABN 65 156 005 668), an authorized Australian Financial Services Licence holder (AFSL no. 421210) regulated by the Australian Securities and Investments Commission.
Important Notice for Residents of the United Arab Emirates
In alignment with local regulatory requirements, individuals residing in the United Arab Emirates are requested to proceed via our dedicated regional platform at startrader.ae, which is operated by STARTRADER Global Financial Consultation & Financial Analysis L.L.C.. This entity is licensed by the UAE Capital Market Authority (CMA) under License No. 20200000241, and is authorised to introduce financial services and promote financial products in the UAE.
Please click the "Continue" button below to be redirected.


