


Gold Technical Analysis
Gold remains in a firmly bearish short-term trend after suffering a sharp decline from the $4,515 high. The market has experienced an accelerated selloff over the past several sessions, resulting in a series of lower highs and lower lows. Price is currently trading below all major moving averages, while the 5-period, 10-period, and 20-period moving averages are aligned negatively, confirming continued downside momentum.
The breakdown below the $4,390 support region marked an important technical development and triggered a new wave of selling pressure. Since then, buyers have struggled to establish any meaningful recovery, with every rally being met by renewed selling
The area around $4,318–$4,330 now represents immediate resistance, followed by $4,347 and the more significant resistance zone near $4,390. On the downside, support is located at the recent low of $4,268. A break below this level could trigger another leg lower toward $4,220 and potentially $4,180. Unless gold can reclaim the 20-period moving average and break above key resistance levels, the short-term outlook remains decisively bearish.
Gold 1H Chart
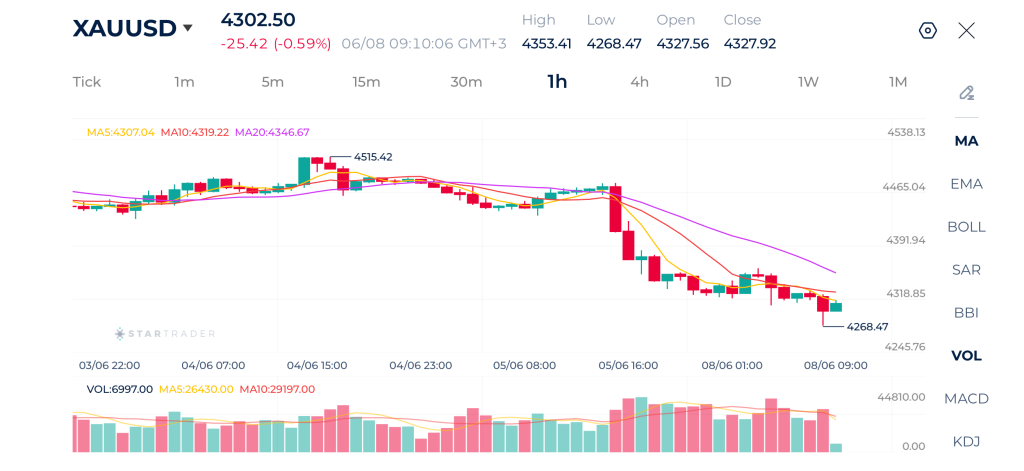
| Resistance | $4,335 | $4,354 | $4,380 |
| Support | $4,268 | $4,248 | $4,160 |
Brent Technical Analysis
Brent crude oil has staged a powerful bullish reversal after finding support near $94.57. The market had been in a clear downtrend for several sessions. However, the sharp recovery from the recent low has significantly improved the short-term technical picture. Price has now climbed back above the 5-period, 10-period, and 20-period moving averages, with the shorter-term averages crossing above the longer-term average, indicating a shift in momentum toward the bulls.
Volume expanded noticeably during the rebound, supporting the strength of the move. If Brent manages to break above $100.50, the bullish recovery could extend toward $102.00 and potentially higher levels. On the downside, initial support is located near $98.50, followed by $97.60 and then the major support zone around $96.60. Overall, the short-term outlook has shifted from bearish to bullish, although traders should monitor the psychological $100 barrier closely.
Brent 1H Chart
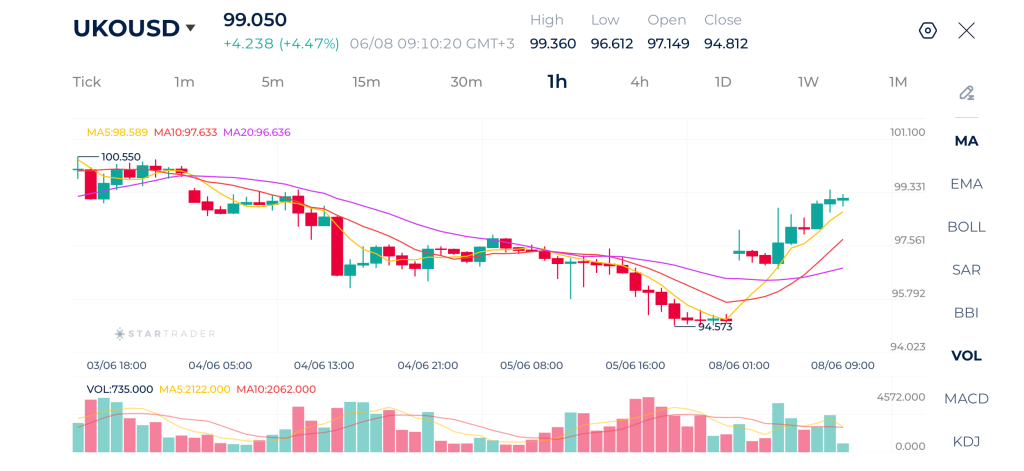
| Resistance | $100.50 | $102.00 | $103.60 |
| Support | $98.50 | $97.60 | $96.60 |
Nasdaq 100 Technical Analysis
The NASDAQ 100 remains under significant bearish pressure despite the latest rebound attempt from the 28,770 low. The index is now trading below the 5-period, 10-period, and 20-period moving averages, while the moving averages themselves remain bearishly aligned, confirming that sellers remain firmly in control of the broader short-term trend.
Immediate resistance is located near 29,160, followed by 29,370 where the 20-period moving average is currently positioned. A break above those levels would be required to improve the technical outlook. On the downside, support remains at 28,770, and a break below that level could expose 28,500 and potentially lower levels. For now, the short-term bias remains bearish while price trades below the moving average cluster.
Nasdaq 100 1H Chart
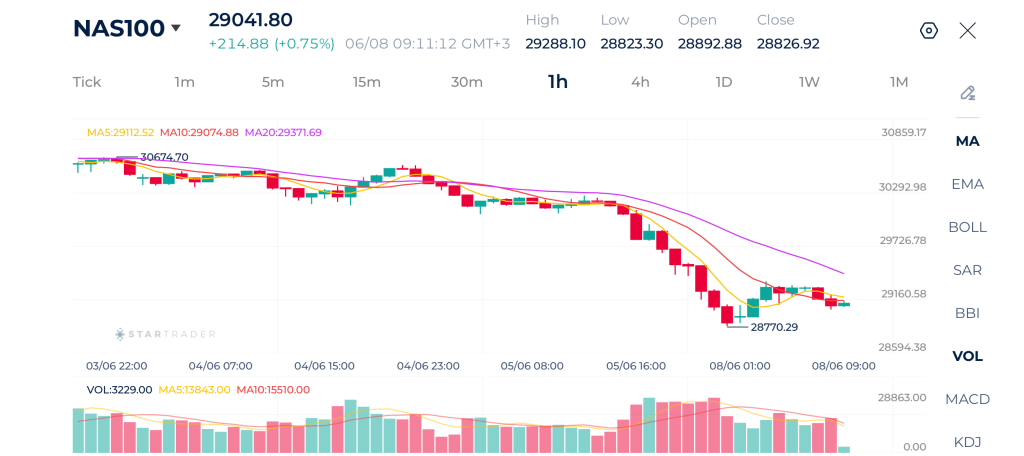
| Resistance | 29,250 | 29,380 | 29,519 |
| Support | 28,732 | 28,565 | 28,395 |
Risk Disclaimer: This material is provided for informational purposes only and does not constitute a recommendation or investment advice. Trading financial instruments on margin involves substantial risk and may not be appropriate for all investors.
Tags
Open Live Account
Please enter a valid country
No results found
No results found
Please enter a valid email
Please enter a valid verification code
1. 8-16 characters + numbers (0-9) 2. blend of letters (A-Z, a-z) 3. special characters (e.g, !a#S%^&)
Please enter the correct format
Please tick the checkbox to proceed
Please tick the checkbox to proceed
Important Notice
STARTRADER does not accept any applications from Australian residents.
To comply with regulatory requirements, clicking the button will redirect you to the STARTRADER website operated by STARTRADER PRIME GLOBAL PTY LTD (ABN 65 156 005 668), an authorized Australian Financial Services Licence holder (AFSL no. 421210) regulated by the Australian Securities and Investments Commission.
CONTINUEImportant Notice for Residents of the United Arab Emirates
In alignment with local regulatory requirements, individuals residing in the United Arab Emirates are requested to proceed via our dedicated regional platform at startrader.ae, which is operated by STARTRADER Global Financial Consultation & Financial Analysis L.L.C.. This entity is licensed by the UAE Capital Market Authority (CMA) under License No. 20200000241, and is authorised to introduce financial services and promote financial products in the UAE.
Please click the "Continue" button below to be redirected.
CONTINUEError! Please try again.

