


 Web Trader MT5













Gold Technical Analysis
Gold is showing a short-term recovery after a sharp correction, but momentum is currently consolidating. Price is around $4,055, having recovered from the recent low near $4,014, while the 5-hour moving average has crossed back above the 10-hour and 20-hour averages. This is a constructive short-term price action, although price is still below the important $4,080–$4,100 resistance area. A sustained move above $4,100 would strengthen the bullish recovery and expose the $4,120–$4,150 region, with the recent high around $4,148 representing the major resistance. On the downside, $4,040–$4,045 is the first support zone, followed by $4,014. For now, the short term bias is mildly bullish, but gold needs to break above $4,100 to confirm that the recovery has more room to run.
Gold 1H Chart
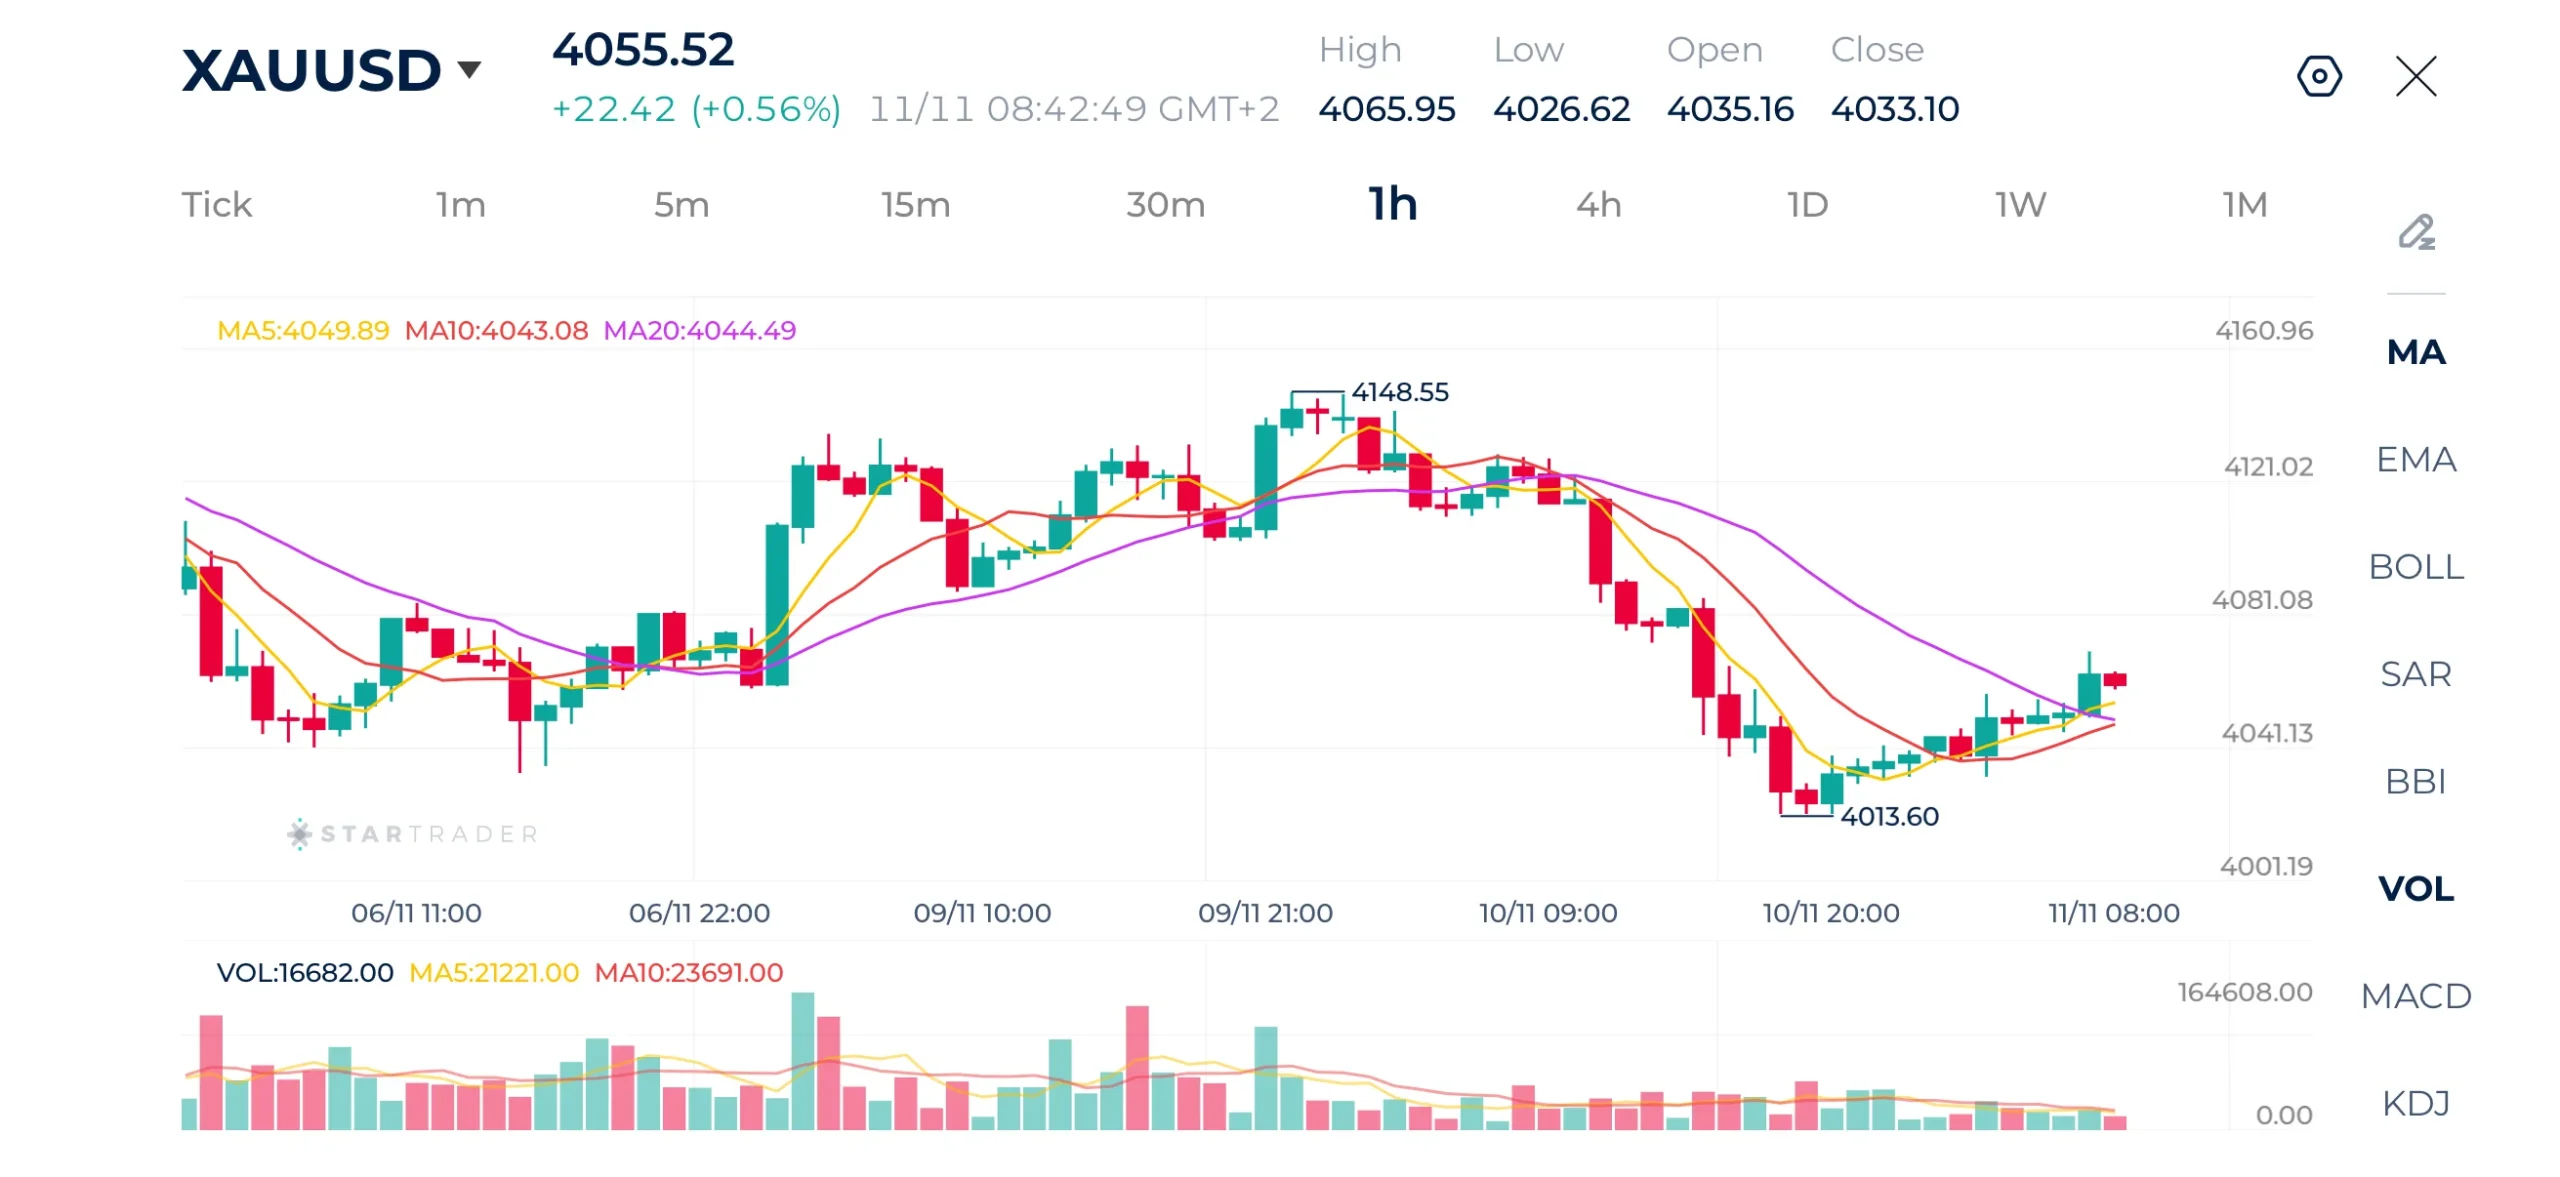
Source: STARTRADER app | Gold shows signa of rebound after nearing the $4,000 support level again
| Resistance | $4,100 | $4,126 | $4,155 |
|---|---|---|---|
| Support | $4,014 | $3,997 | $3,960 |
Brent Technical Analysis
Brent crude remains in a clear short term downtrend, despite the modest recovery visible in the latest candles. Price is around $94.93, having bounced from the recent low near $91.76.
The rebound has so far stalled around the $95.00–$95.30 region, which is the immediate resistance zone. A sustained break above $95.30 could allow a recovery toward $96.00–$96.20, but the price would need to regain the $96–$97 area to materially improve the technical picture. On the downside, $93.30 is the first support, followed by the $91.75 low. Therefore, the short term bias is neutral to bearish, with the current move looking more like a corrective rebound within a broader downtrend.
Brent 1H Chart
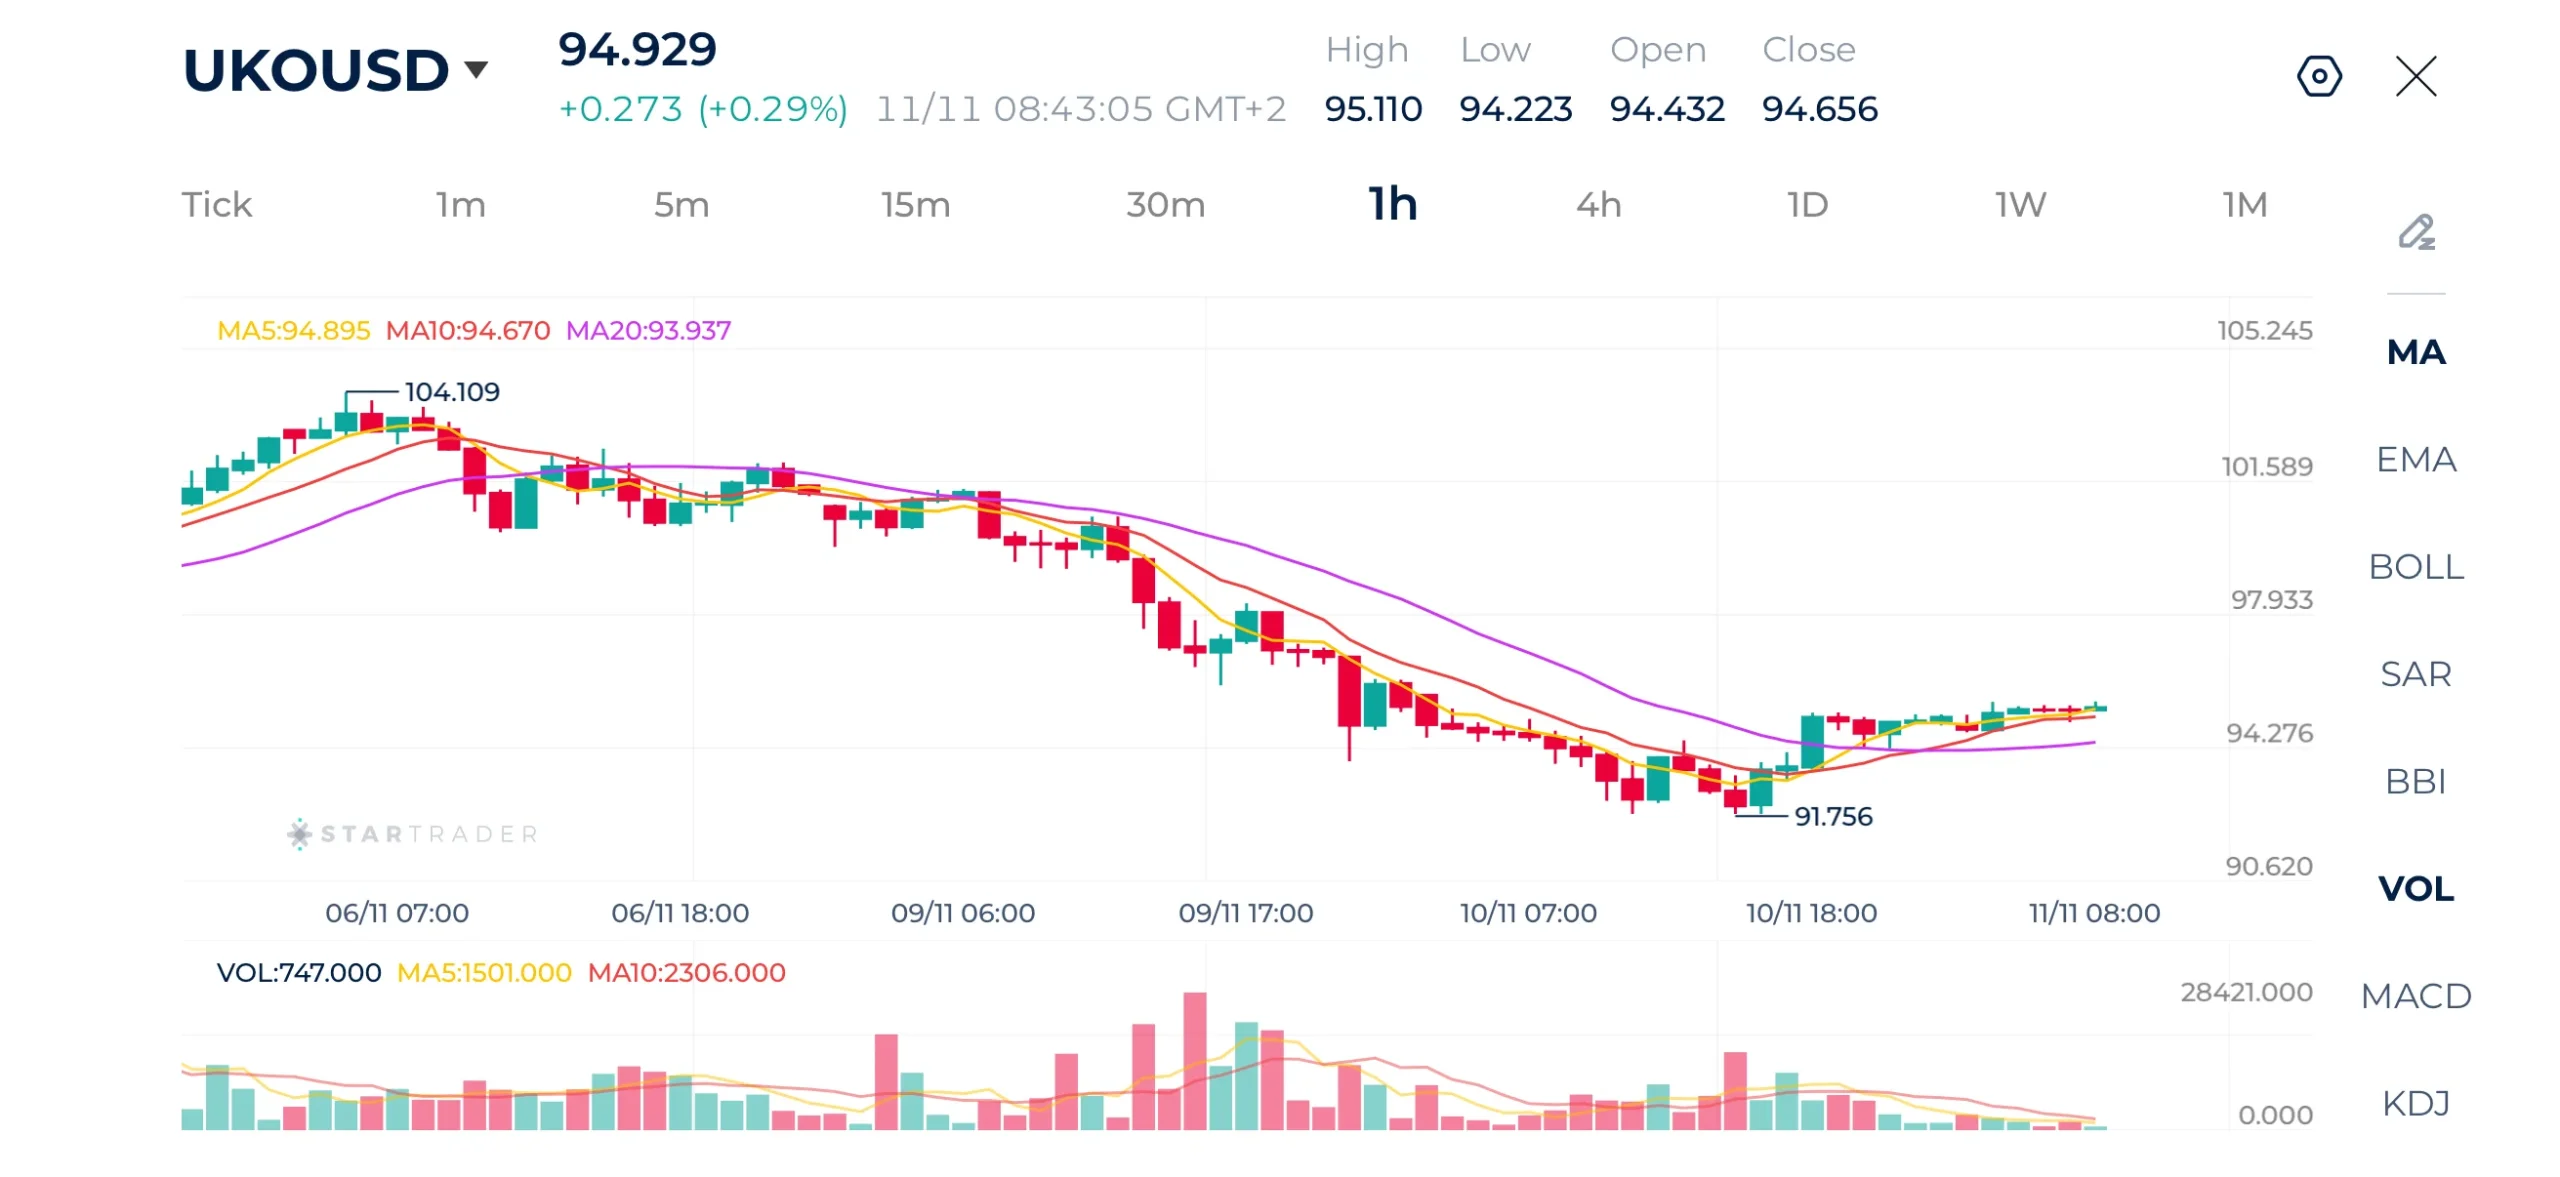
Source: STARTRADER app | Crude brent rebounds after a wave of selling
| Resistance | $95.30 | $96.20 | $97.00 |
|---|---|---|---|
| Support | $93.30 | $91.75 | $90.00 |
Nasdaq Technical Analysis
On the 1-hour chart, Nasdaq 100 is showing a strong bullish recovery after the sharp sell-off earlier. Price has moved above the 27,800 area and is currently testing the recent high around 28,197. The short term moving averages are clearly bullish, with the 5-hour MA above the 10-hour and 20-hour averages, while price remains above all three. This confirms that momentum has shifted back toward the upside.
The immediate resistance is around 28,200, followed by the 28,350–28,400 area. On the downside, 27,800 is now the first important support, followed by 27,360–27,400. As long as the index holds above 27,800, the short-term bias remains bullish, with a break above 28,200 potentially opening the way toward 28,350–28,400.
Nasdaq 1H Chart
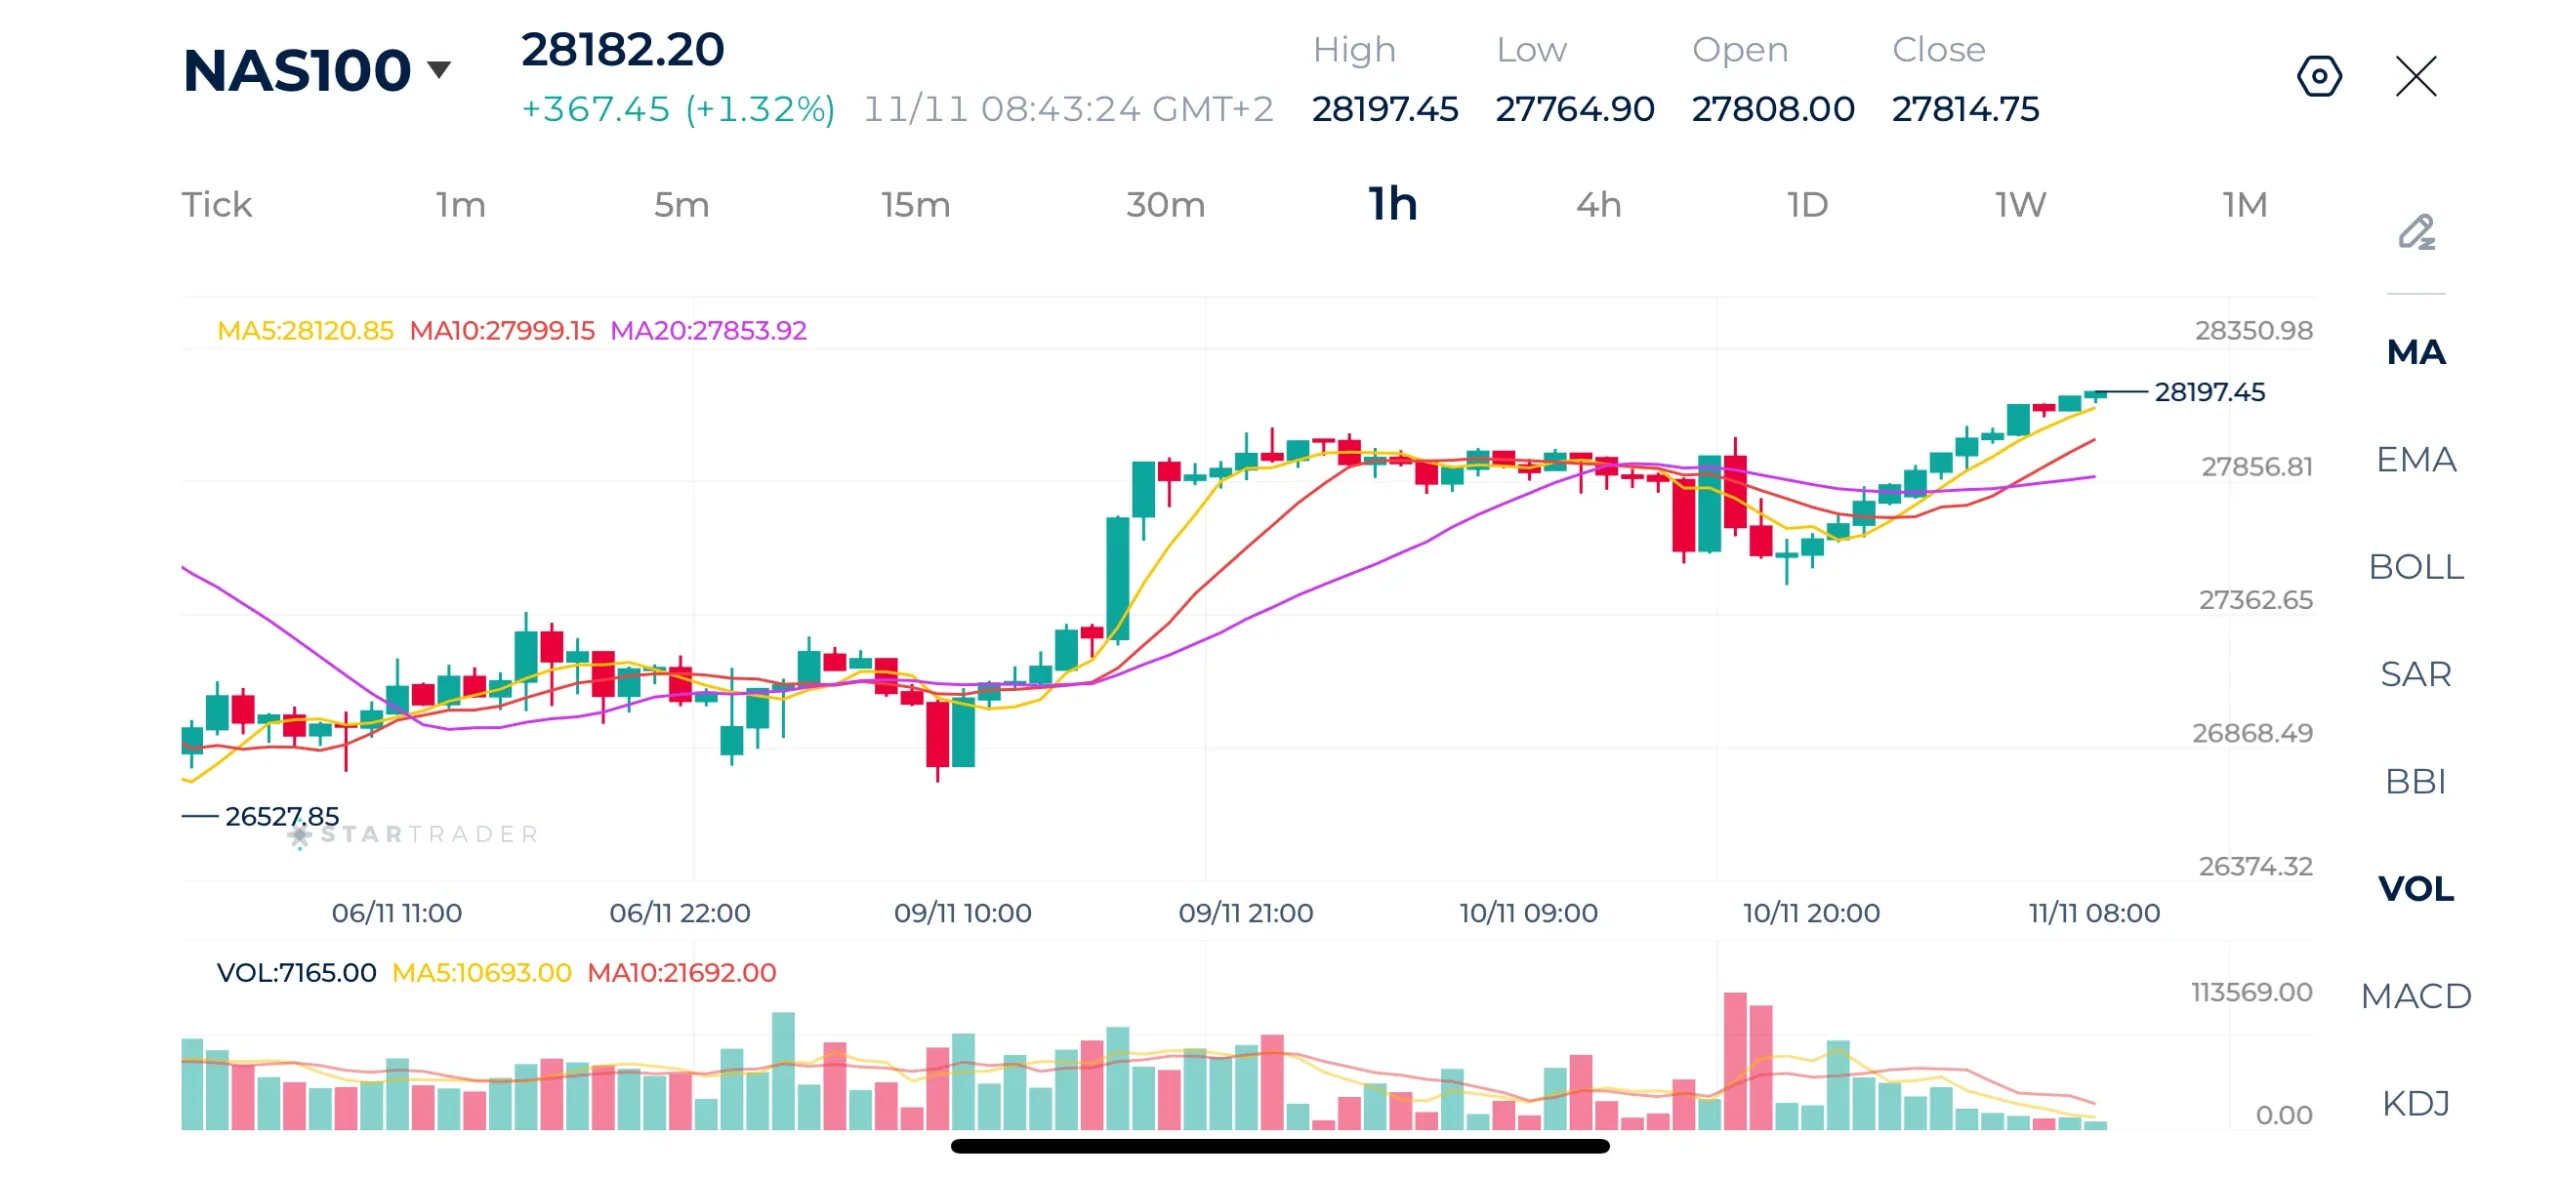
Source: Nasdaq shows a sustained bullish recovery this week
| Resistance | 28,200 | 28,350 | 28,500 |
|---|---|---|---|
| Support | 27,665 | 27,360 | 27,185 |
Risk Disclaimer: This material is provided for informational purposes only and does not constitute a recommendation or investment advice. Trading financial instruments on margin involves substantial risk and may not be appropriate for all investors.
Tags


Open Live Account
 Email Address
 Phone Number
Important Notice
STARTRADER does not accept any applications from Australian residents.
To comply with regulatory requirements, clicking the button will redirect you to the STARTRADER website operated by STARTRADER PRIME GLOBAL PTY LTD (ABN 65 156 005 668), an authorized Australian Financial Services Licence holder (AFSL no. 421210) regulated by the Australian Securities and Investments Commission.
Important Notice for Residents of the United Arab Emirates
In alignment with local regulatory requirements, individuals residing in the United Arab Emirates are requested to proceed via our dedicated regional platform at startrader.ae, which is operated by STARTRADER Global Financial Consultation & Financial Analysis L.L.C.. This entity is licensed by the UAE Capital Market Authority (CMA) under License No. 20200000241, and is authorised to introduce financial services and promote financial products in the UAE.
Please click the "Continue" button below to be redirected.


