








 Web Trader MT5











Gold Technical Analysis
Gold is currently trading within a corrective bearish structure on the intraday timeframe, following yesterday’s rally that peaked near $4,857. The rejection from this level was decisive, with a clear shift from bullish momentum into a sequence of lower highs and lower lows, confirming short term bearish control.
The price is now stabilizing around the $4,700–$4,730 region, where we can observe a slowdown in selling pressure.
Technically, the key level to watch on the upside is the $4,780–$4,800 resistance zone, which aligns with the previous breakdown area and the descending moving averages. A break above this zone would indicate a potential shift back toward bullish momentum. On the downside, a break below $4,700 would likely resume the bearish move toward deeper support levels around $4,650.
Overall, gold remains in a corrective phase, with price reacting heavily to USD strength and shifting rate expectations.
Gold 1H Chart
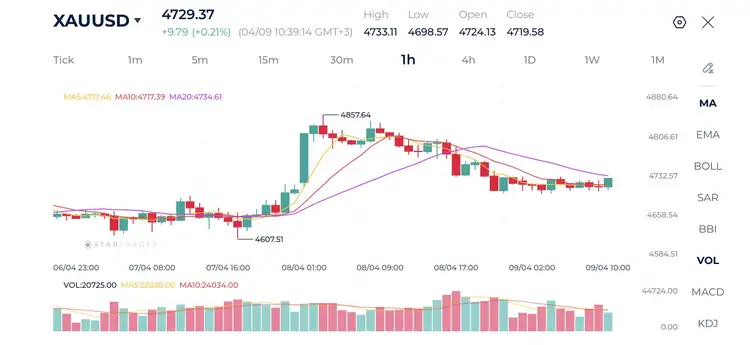
| Resistance | $4,736 | $4,780 | $4,812 |
| Support | $4,697 | $4,656 | $4,615 |
Brent Technical Analysis
Oil experienced a strong bearish breakdown from the $114 area, dropping sharply to around $92.70. Since then, price has started forming higher lows, indicating an early recovery phase.
The market is gradually reclaiming short-term moving averages, showing that bearish momentum is weakening. However, the recovery still looks corrective.
Oil is currently in a short term recovery, but the overall structure is still fragile. The next move depends on whether price can hold above current levels and break resistance.
In the short term, oil appears to be in a technical recovery phase after an oversold condition, with price attempting to build a base above $95–$97. If the market manages to hold above this zone and break above $100, we could see a continuation toward higher resistance levels.
However, failure to sustain above current levels would likely result in a renewed bearish move, potentially retesting the $92.70 low. Overall, the market remains in a fragile balance between recovery and continuation of the prior downtrend, and confirmation will depend on whether buyers can maintain control above key resistance.
Brent 1H Chart
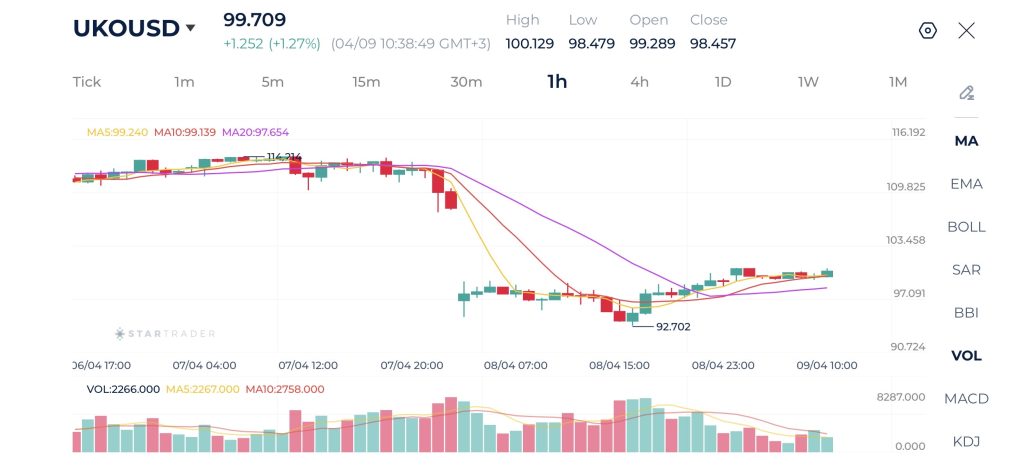
| Resistance | $101.25 | $103.76 | $107.81 |
| Support | $93.27 | $92.70 | $90.24 |
Dow Jones Technical Analysis
The Dow Jones showed a strong impulsive move yesterday, heading aggressively toward the 47,700–47,800 resistance area. This move is clearly supported by a sharp expansion in bullish candles, indicating strong institutional participation and momentum driven buying. The alignment of short-term moving averages above longer term ones further confirms that the immediate trend remains bullish.
However, after reaching the highs near 48,000, price action has transitioned into a tight consolidation phase, with smaller candles and reduced volatility. This reflects a temporary pause in bullish momentum.
From a structural perspective, as long as price holds above the 47,600–47,700 support zone, the bullish bias remains intact, and this consolidation can be seen as a continuation pattern. A breakout above 48,000 would likely trigger another leg higher. However, a breakdown below this support could signal a deeper pullback toward the 47,000–46,800 region, where previous demand is located.
1H Chart
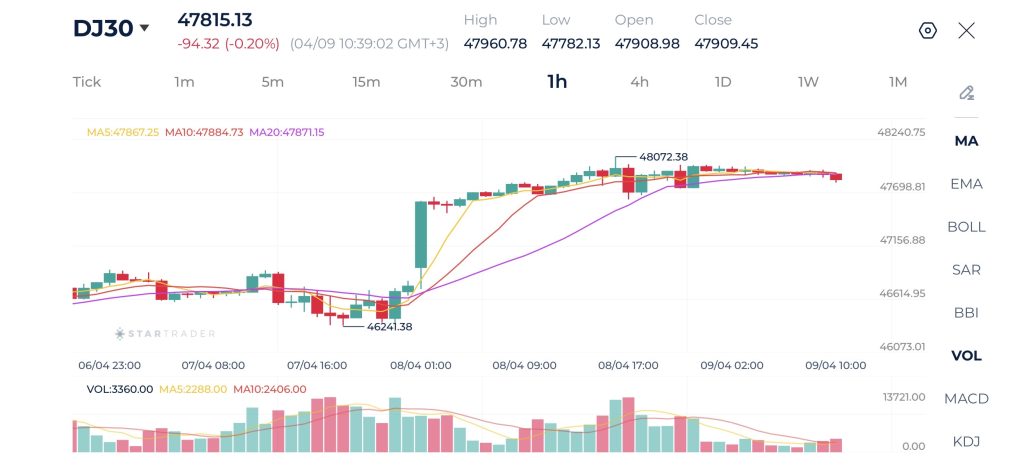
| Resistance | 47,930 | 48,075 | 48,217 |
| Support | 47,552 | 47,421 | 47,181 |
Risk Disclaimer: This material is provided for informational purposes only and does not constitute a recommendation or investment advice. Trading financial instruments on margin involves substantial risk and may not be appropriate for all investors.
Tags


Open Live Account
 Email Address
 Phone Number
Important Notice
STARTRADER does not accept any applications from Australian residents.
To comply with regulatory requirements, clicking the button will redirect you to the STARTRADER website operated by STARTRADER PRIME GLOBAL PTY LTD (ABN 65 156 005 668), an authorized Australian Financial Services Licence holder (AFSL no. 421210) regulated by the Australian Securities and Investments Commission.
Important Notice for Residents of the United Arab Emirates
In alignment with local regulatory requirements, individuals residing in the United Arab Emirates are requested to proceed via our dedicated regional platform at startrader.ae, which is operated by STARTRADER Global Financial Consultation & Financial Analysis L.L.C.. This entity is licensed by the UAE Capital Market Authority (CMA) under License No. 20200000241, and is authorised to introduce financial services and promote financial products in the UAE.
Please click the "Continue" button below to be redirected.


