


Gold Technical Analysis
Gold has been consolidating after a strong upward move from the 3$,311 support base. Price is currently hovering around $3,380, with short-term moving averages (5 and 10) flattening against the 30-period moving average.
MACD shows bearish signs as the MACD line has crossed below the signal line, indicating short-term downside pressure.
Key support to watch out for is at $3,360, and if this level breaks, a deeper pullback toward $3,340 is possible. On the other hand, strong resistance remains at $3,395. A sustained break above this price level could open the path to $3,420.
Gold 1H Chart
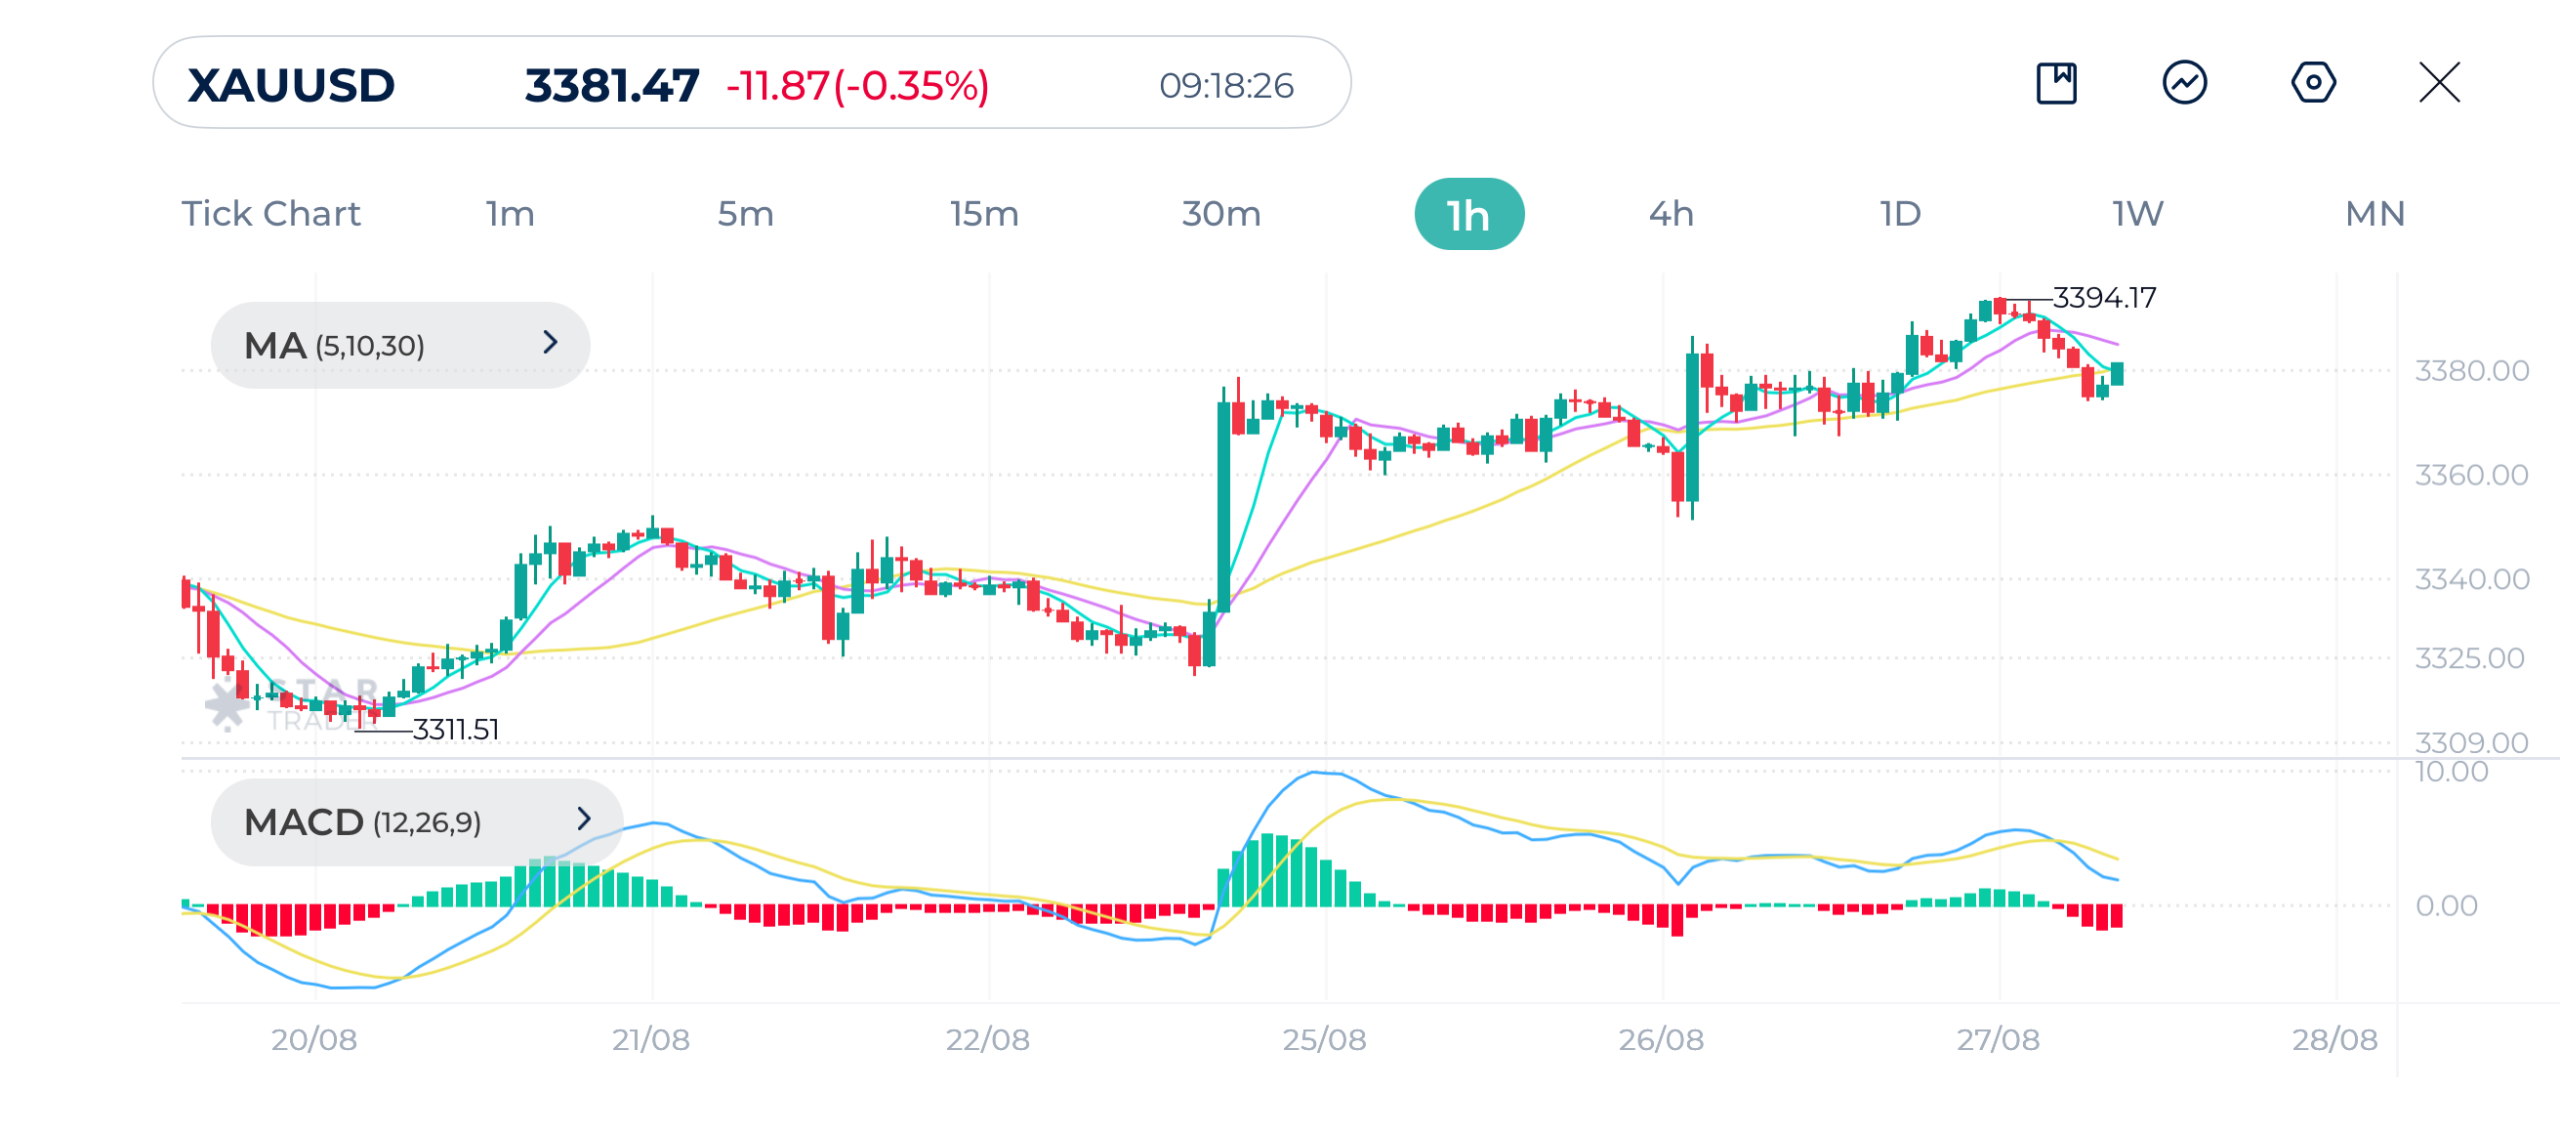
| Resistance | $3,392 | $3,409 | $3,427 |
| Support | $3,373 | $3,361 | $3,351 |
Nvidia Technical Analysis
NVIDIA rebounded sharply from its $168.75 low of last week and is currently trading near $181.6 after reclaiming short-term moving averages.
The price is pressing against local highs, showing signs of strong buying interest. The moving averages (5 and 10) are aligned bullishly above the 30-period moving average, and the MACD is still in positive territory.
Immediate resistance is at $183.8, the recent swing high. A breakout above this level would confirm the continuation of the uptrend toward $186–$188.
On the downside, support lies at $178, and a break below could pressure price downwrd toward $175 again.
Nvidia 1H Chart
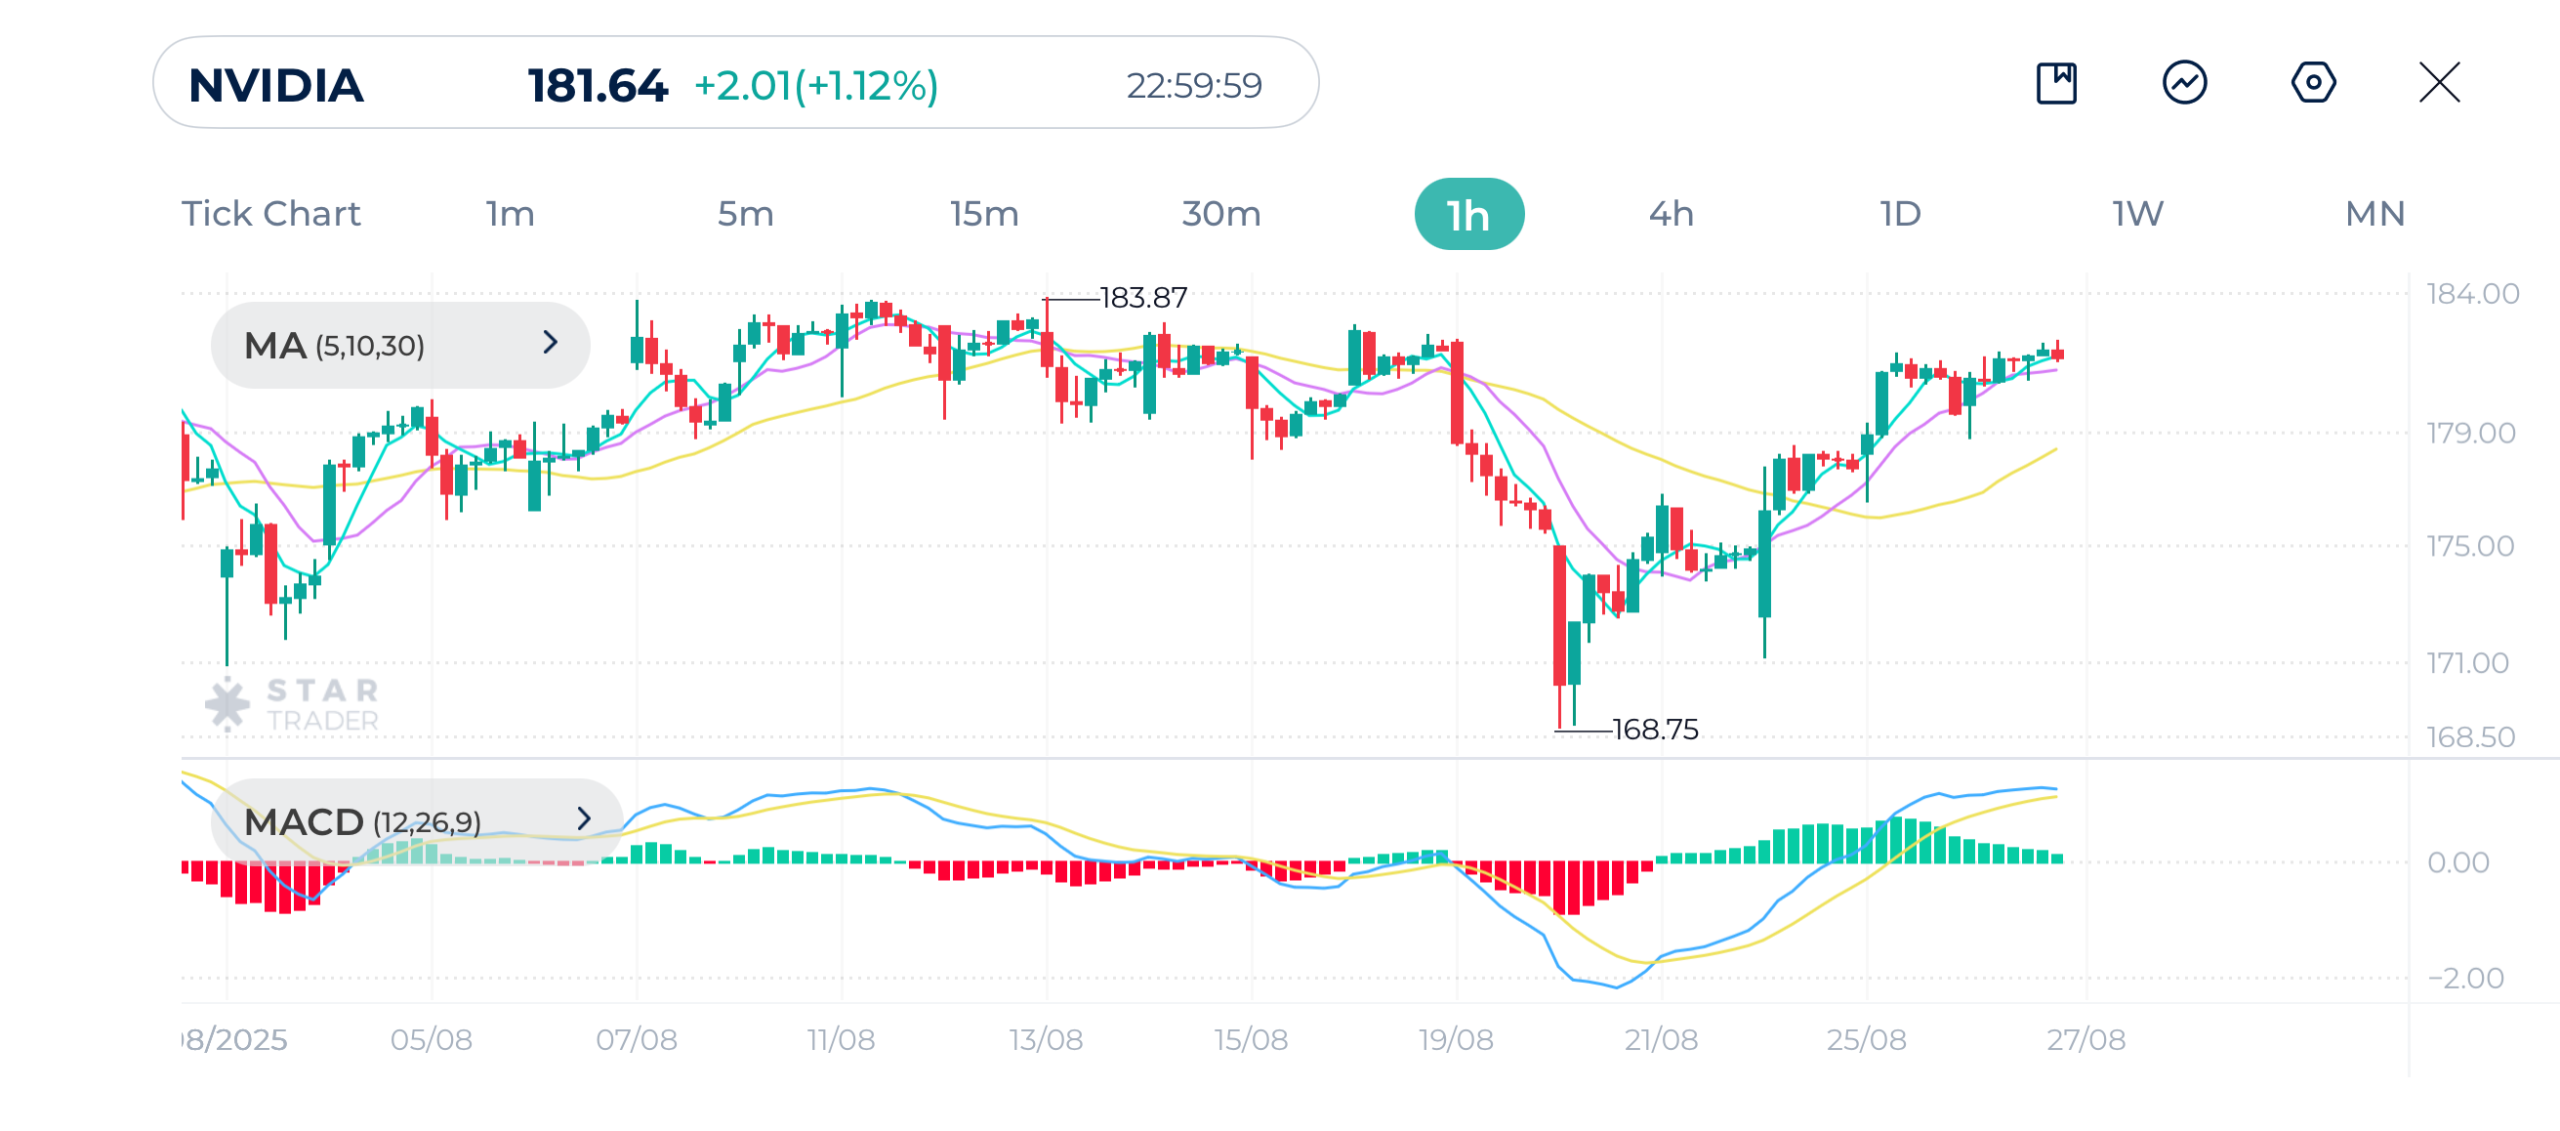
| Resistance | $183.92 | $187.21 | $191.00 |
| Support | $178.80 | $176.54 | $171.11 |
Ether Technical Analysis
Ethereum has seen a strong rally from the $4,105 support zone on the hourly chart, reaching a new all-time high $4,955 before pulling back. Currently, price action is consolidating near $4,600.
The moving averages (5 and 10) are trending above the 30-period moving average, indicating bullish momentum is regaining strength after the recent correction.
MACD is now turning upward with histogram bars moving into green. This indicates a potential continuation of the recovery.
If buyers hold prices above the short-term moving averages, Eth could attempt another test of the $4,950 record high.
Ether 1H Chart
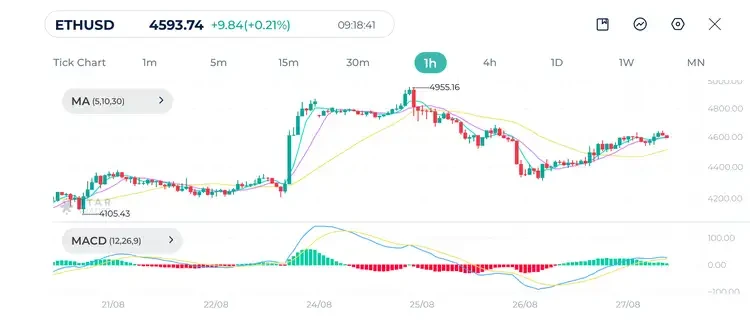
| Resistance | $4,682 | $4,718 | $4,840 |
| Support | $4,551 | $4,492 | $4,393 |
Tags
Open Live Account
Please enter a valid country
No results found
No results found
Please enter a valid email
Please enter a valid verification code
1. 8-16 characters + numbers (0-9) 2. blend of letters (A-Z, a-z) 3. special characters (e.g, !a#S%^&)
Please enter the correct format
Please tick the checkbox to proceed
Please tick the checkbox to proceed
Important Notice
STARTRADER does not accept any applications from Australian residents.
To comply with regulatory requirements, clicking the button will redirect you to the STARTRADER website operated by STARTRADER PRIME GLOBAL PTY LTD (ABN 65 156 005 668), an authorized Australian Financial Services Licence holder (AFSL no. 421210) regulated by the Australian Securities and Investments Commission.
CONTINUEImportant Notice for Residents of the United Arab Emirates
In alignment with local regulatory requirements, individuals residing in the United Arab Emirates are requested to proceed via our dedicated regional platform at startrader.ae, which is operated by STARTRADER Global Financial Consultation & Financial Analysis L.L.C.. This entity is licensed by the UAE Capital Market Authority (CMA) under License No. 20200000241, and is authorised to introduce financial services and promote financial products in the UAE.
Please click the "Continue" button below to be redirected.
CONTINUEError! Please try again.

