








 Web Trader MT5











Gold Technical Analysis
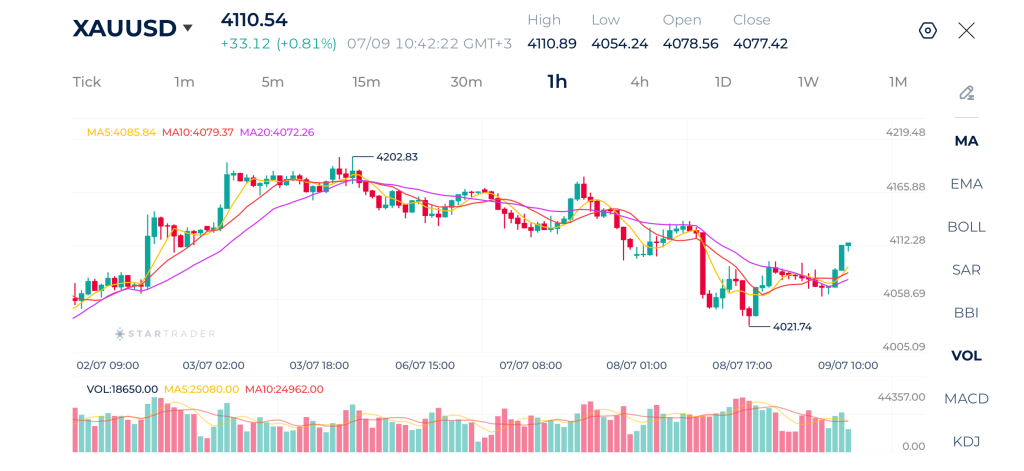
Gold has staged a strong rebound after successfully defending support near $4,021. Buyers have regained control, driving prices back above the short-term moving averages. The 5-period MA has crossed above both the 10- and 20-period moving averages, while the 10-period MA is also turning higher, confirming renewed bullish momentum.
The sharp recovery has created higher highs and higher lows on the hourly timeframe, indicating buyers are regaining control. Price has reclaimed the key $4,100 psychological level and is approaching the next resistance around $4,112–$4,120.
The short-term outlook has shifted back to bullish following the strong rebound from support. A sustained break above $4,112 would strengthen buying momentum and open the way toward $4,165, with $4,203 remaining the next major resistance. On the downside, maintaining support above $4,080 would preserve the current recovery structure, while a break below this level could trigger another retest of $4,055 and $4,022.
Gold 1H Chart
| Resistance | $4,120 | $4,170 | $4,200 |
| Support | $4,080 | $4,021 | $3,964 |
Brent Technical Analysis
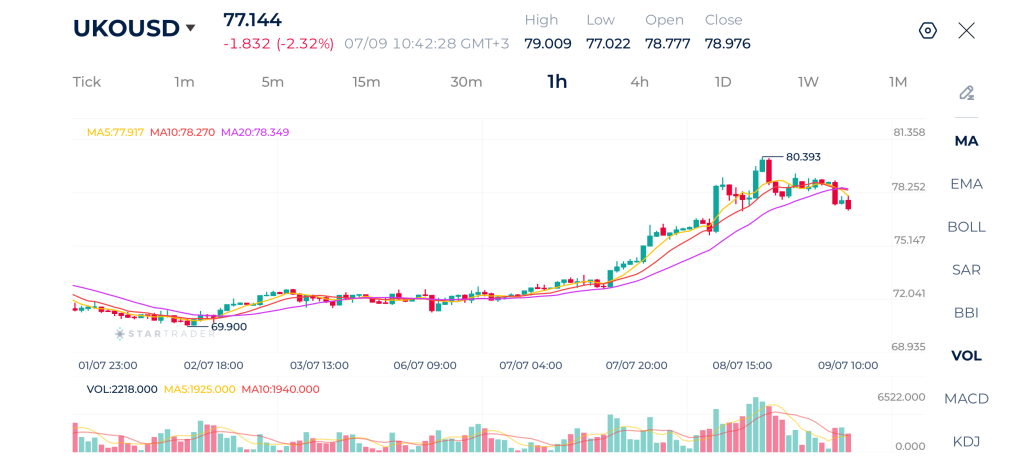
Brent crude has entered a corrective phase after reaching a fresh rally high at $80.39. The market experienced strong profit-taking, pushing prices sharply lower toward $77.00. Although the broader trend remains positive, the short-term momentum has shifted bearish as the 5-period moving average crossed below the 10-period MA, with both now turning lower toward the 20-period moving average.
The current pullback is testing an important support area around the 20-period moving average, which could determine whether the broader uptrend resumes or a deeper correction develops.
The immediate outlook has turned neutral to slightly bearish following the sharp correction. Holding above $77.00 could encourage buyers to return and target $78.25 again. However, a decisive break below $77.00 would expose $76.20, while a recovery above $78.25 would indicate that the recent decline was merely a healthy pullback within the broader bullish trend.
Brent 1H Chart
| Resistance | $78.70 | $80.39 | $82.35 |
| Support | $76.00 | $75.14 | $73.72 |
Dow Jones Technical Analysis
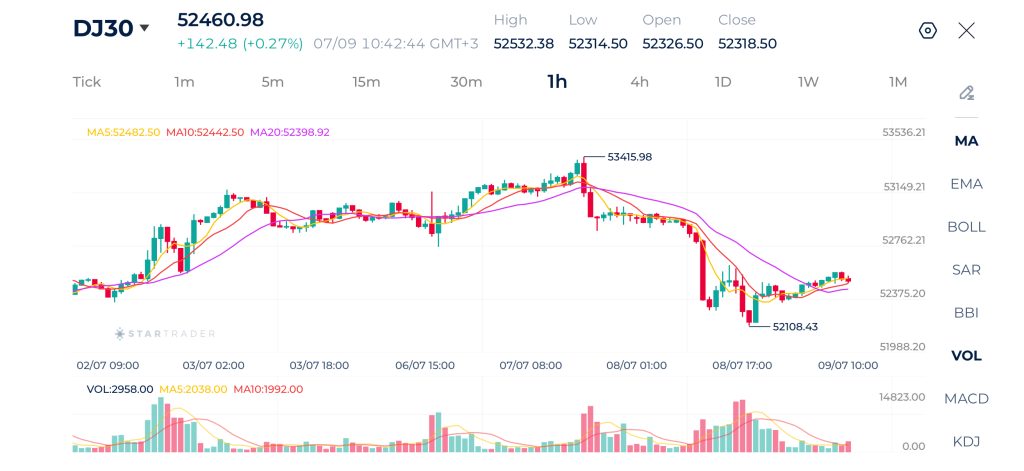
The Dow Jones remains under short-term bearish pressure despite recovering from yesterday’s sharp selloff. After failing at 53,415, the index declined aggressively toward 52,108 where buyers stepped in to defend support. Price has since rebounded, but it continues to trade below the descending 20-period moving average, indicating that the broader short-term trend remains negative.
The 5-period MA has crossed above the 10-period MA, reflecting improving short-term momentum, although both remain beneath the 20 MA, suggesting the recovery is still corrective rather than a confirmed trend reversal.
A break above the descending 20-period moving average would strengthen the recovery outlook, while failure below recent support could revive bearish momentum.
The short-term outlook remains cautiously bearish while the index trades below 52,760. A sustained move above this level would shift momentum in favor of buyers and expose 53,150. Conversely, a break below 52,375 would likely trigger another test of 52,108, with further downside toward 51,900 if selling pressure accelerates.
Dow Jones 1H Chart
| Resistance | 52,635 | 52,961 | 53,153 |
| Support | 52,249 | 52,071 | 51,998 |
Risk Disclaimer: This material is provided for informational purposes only and does not constitute a recommendation or investment advice. Trading financial instruments on margin involves substantial risk and may not be appropriate for all investors.
Tags


Open Live Account
 Email Address
 Phone Number
Important Notice
STARTRADER does not accept any applications from Australian residents.
To comply with regulatory requirements, clicking the button will redirect you to the STARTRADER website operated by STARTRADER PRIME GLOBAL PTY LTD (ABN 65 156 005 668), an authorized Australian Financial Services Licence holder (AFSL no. 421210) regulated by the Australian Securities and Investments Commission.
Important Notice for Residents of the United Arab Emirates
In alignment with local regulatory requirements, individuals residing in the United Arab Emirates are requested to proceed via our dedicated regional platform at startrader.ae, which is operated by STARTRADER Global Financial Consultation & Financial Analysis L.L.C.. This entity is licensed by the UAE Capital Market Authority (CMA) under License No. 20200000241, and is authorised to introduce financial services and promote financial products in the UAE.
Please click the "Continue" button below to be redirected.


