


Gold Technical Analysis
Gold is attempting to recover after experiencing a sharp selloff. The precious metal found support around $4,122 and has since staged a rebound, pushing back above the 5-period and 10-period moving averages. This recovery has improved short-term sentiment, although the broader trend remains neutral to slightly bearish as prices continue to trade near the 20-period moving average.
From a technical perspective, the $4,175–$4,180 region has become an important short-term support level, reinforced by the clustering of the moving averages. A break below this support would likely shift momentum back in favor of the sellers and expose the recent low around $4,122. For now, the recovery remains intact, but confirmation of a broader bullish reversal would require a sustained move above $4,250 and eventually a challenge of the $4,382 swing high.
Key Takeaway
Gold 1H Chart
| Resistance | $4,270 | $4,329 | $4,382 |
| Support | $4,175 | $4,121 | $3,965 |
Brent Technical Analysis
Brent crude remains under bearish pressure despite a brief recovery attempt during the previous session. The market continues to trade below the 20-period moving average, while the 5-period moving average has crossed below the 10-period moving average, signaling renewed downside momentum. Price action has been characterized by lower highs and lower lows, reinforcing the short-term bearish structure.
After rebounding from the $77.22 low, Brent managed to recover toward the $82.20 resistance area. However, buyers failed to sustain the move, and prices quickly reversed lower, indicating that sellers remain active on rallies. The sharp rejection from resistance suggests that market participants continue to focus on expectations of improved global oil supply conditions rather than supply disruptions.
The current decline has brought prices back toward the key support zone around $79.00–$79.30. A sustained break below this area could expose the recent swing low near $77.20. On the upside, resistance is now located near $80.30, followed by stronger resistance around $81.50–$82.20. Until Brent can reclaim and hold above these resistance levels, the technical outlook remains tilted to the downside, with rallies likely to encounter selling pressure.
Brent 1H Chart
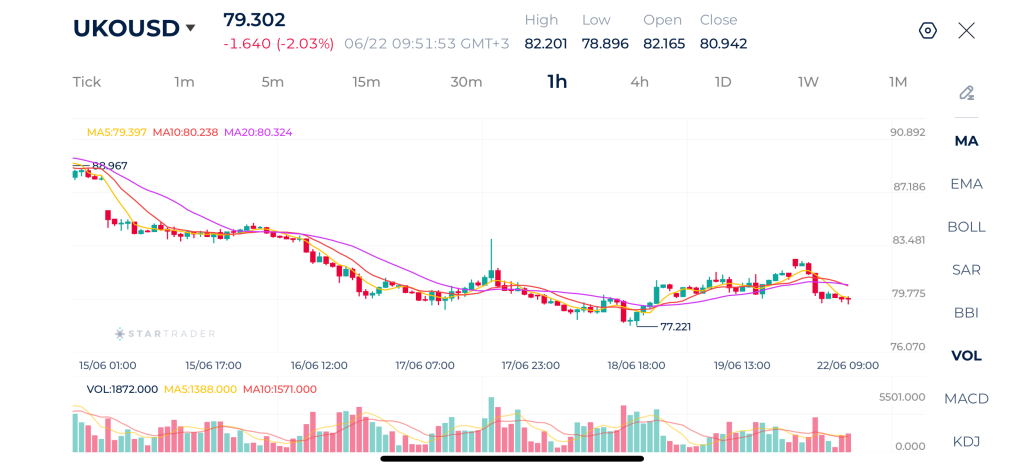
| Resistance | $80.25 | 81.75 | $83.40 |
| Support | $77.20 | $75.80 | $74.38 |
Nikkei Technical Analysis
The Nikkei 225 remains in a strong bullish trend, continuing to record higher highs and higher lows while trading above all major moving averages. The index recently surged to a fresh record high near 73,035, extending the impressive rally that has dominated price action throughout the past week. The 5-period moving average remains above the 10-period moving average, while both are positioned above the 20-period moving average, confirming strong positive momentum and a healthy bullish market structure.
From a technical perspective, immediate support is located around 72,300–72,500, where the short-term moving averages converge. A deeper correction could find support near the rising 20-period moving average around 72,100. On the upside, a decisive break above 73,035 would confirm the continuation of the uptrend and potentially open the door toward 73,500 and beyond. As long as the index remains above the 20-period moving average, the overall bias remains firmly bullish.
Nikkei 1H Chart
| Resistance | 73,035 | 73,120 | 73,300 |
| Support | 72,350 | 72,200 | 72,000 |
Risk Disclaimer: This material is provided for informational purposes only and does not constitute a recommendation or investment advice. Trading financial instruments on margin involves substantial risk and may not be appropriate for all investors.
Tags
Open Live Account
Please enter a valid country
No results found
No results found
Please enter a valid email
Please enter a valid verification code
1. 8-16 characters + numbers (0-9) 2. blend of letters (A-Z, a-z) 3. special characters (e.g, !a#S%^&)
Please enter the correct format
Please tick the checkbox to proceed
Please tick the checkbox to proceed
Important Notice
STARTRADER does not accept any applications from Australian residents.
To comply with regulatory requirements, clicking the button will redirect you to the STARTRADER website operated by STARTRADER PRIME GLOBAL PTY LTD (ABN 65 156 005 668), an authorized Australian Financial Services Licence holder (AFSL no. 421210) regulated by the Australian Securities and Investments Commission.
CONTINUEImportant Notice for Residents of the United Arab Emirates
In alignment with local regulatory requirements, individuals residing in the United Arab Emirates are requested to proceed via our dedicated regional platform at startrader.ae, which is operated by STARTRADER Global Financial Consultation & Financial Analysis L.L.C.. This entity is licensed by the UAE Capital Market Authority (CMA) under License No. 20200000241, and is authorised to introduce financial services and promote financial products in the UAE.
Please click the "Continue" button below to be redirected.
CONTINUEError! Please try again.

