


market news summary
U.S. Dollar Index (USDX)
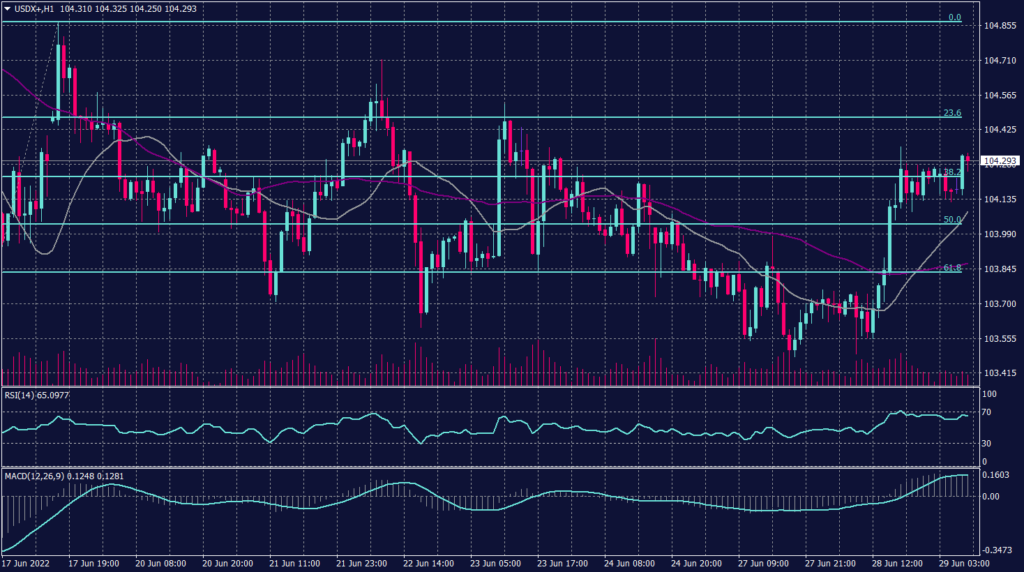
The Dollar Index was up 0.01% to 104.51 this morning in Asia, with investors considering the risk of a recession caused by major central banks’ interest rate hikes. Additionally, inflation worries are still on investors’ radar as U.S. conference board (CB) consumer confidence fell to a 16-month low in June as high inflation left consumers to worry about a slowing economy.
Technically:
The daily chart indicates a continuation of the uptrend in the long term under the condition of holding above 104. Technical indicators can’t confirm the continuation while moving averages show horizontal signals. The hourly chart shows an upward movement but keeps the tendency for a decline.
PIVOT POINT: 104.00
| SUPPORT | RESISTANCE |
| 103.50 | 104.60 |
| 102.60 | 105.10 |
| 102.30 | 105.60 |
Euro (EURUSD)
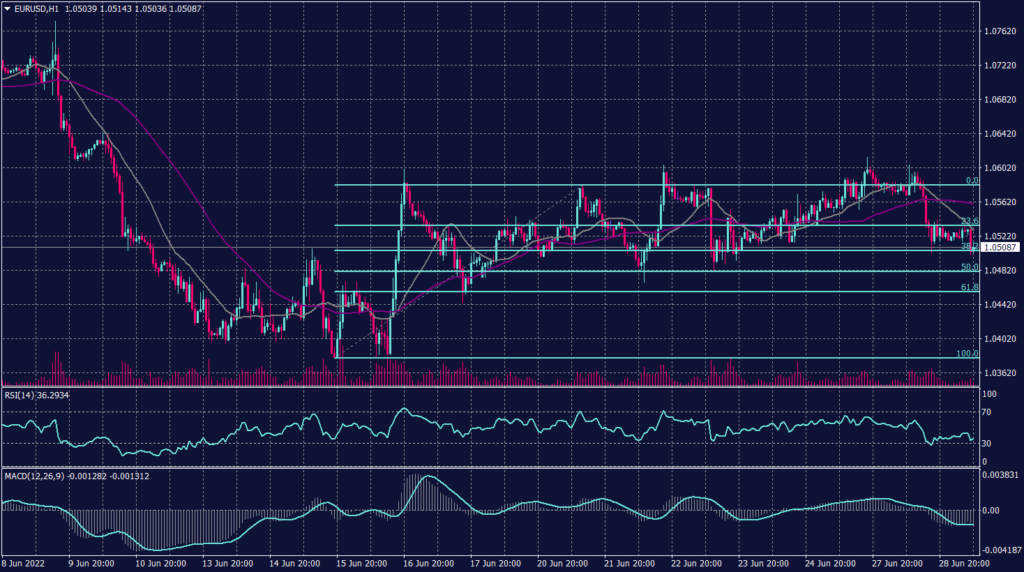
The euro rose 0.11% to $1.05315 after dipping to $1.0490 on Tuesday after European Central Bank (ECB) chief Christine Lagarde offered no fresh insight on the path for European interest rates at the ECB’s annual forum. However, the ECB is widely expected to follow its global peers by raising interest rates in July for the first time in a decade to try to cool soaring inflation, though economists are divided on the magnitude of any hike.
Technically:
On the hourly chart, the Euro tested the resistance at 1.0600 for the third time with shorter swings which indicates a possibility of a breakthrough. The EURUSD was optimistic this morning and traded in a corrective trend between 1.0550 and 1.0600. Meanwhile, the pair remains in the declining channel towards 1.0400, while technical indicators confirm the decline on the daily chart.
PIVOT POINT:1.0600
| SUPPORT | RESISTANCE |
| 1.0530 | 1.0670 |
| 1.0500 | 1.0630 |
| 1.0450 | 1.0690 |
Sterling Pound (GBPUSD)
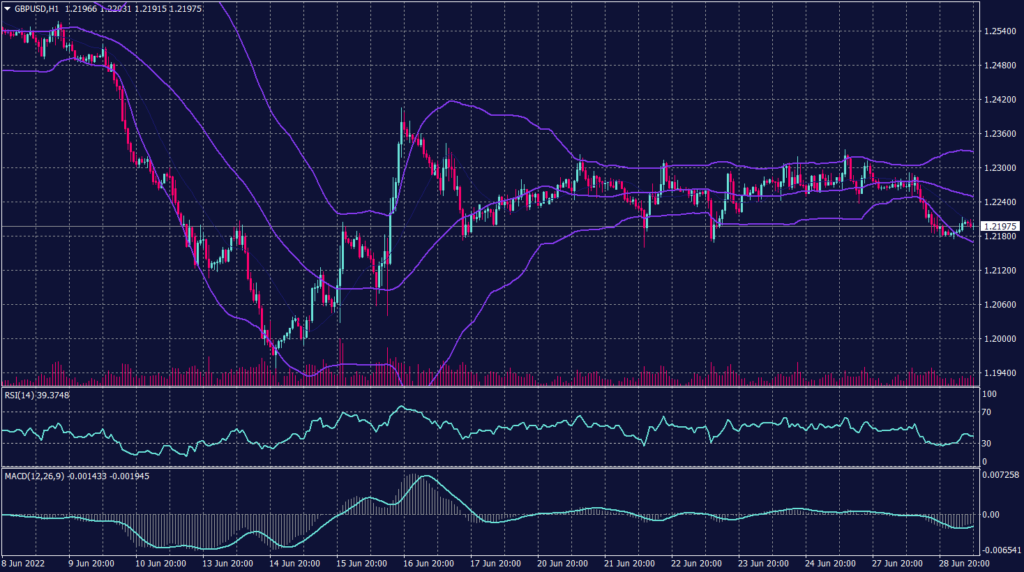
The sterling pound remains moving horizontally and shows a cautious trading environment. On the daily chart, the pair remains to weaken and targets its lowest level since March 2020 between 1.1446 and 1.1410. The cable cannot find shelter in the upcoming BOE statement unless it massively exceeded market expectations.
PIVOT POINT:1.2180
| SUPPORT | RESISTANCE |
| 1.1950 | 1.2300 |
| 1.1820 | 1.2380 |
| 1.1700 | 1.2480 |
Spot Gold (XAUUSD)
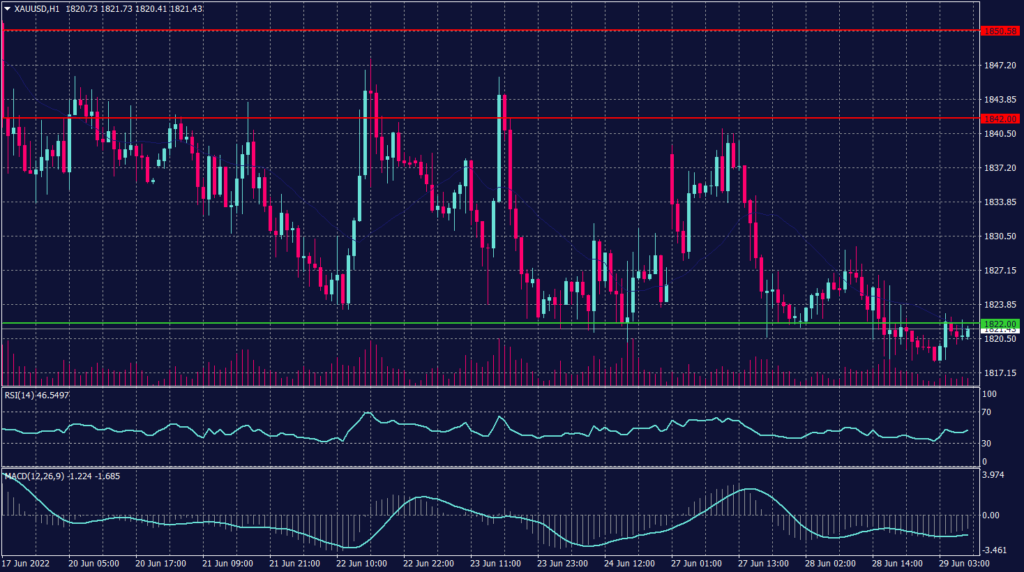
Gold was up 0.04% to 1,821.95 this morning in Asia, supported by recession concerns as U.S. 10-year Treasury yields eased. Bullion was caught between pressure from prospects of higher interest rates and support from recession risks. Moreover, the U.S. Consumer Confidence Index fell to a 16-month low in June as high inflation left consumers to worry about a slowing economy.
The U.S. banned new imports of Russian gold, acting on commitments made by the Group of Seven leaders this week to further punish Russia over its invasion of Ukraine.
Technically:
Gold is expected to remain strong as long as it is traded above 1,820 and is expected to trade above 1,835 before the European session. The hourly chart shows strong support above 1,820 and signals a possibility of trading above 1,830. Meanwhile, technical indicators are neutral and the 20-period moving average is positive above 1,825.
The daily chart, however, shows a horizontal trend and an increased possibility of a decline between 1,810 and 1,800. Additionally, price action confirms the decline on the daily chart under the condition of breaking below 1,820.
PIVOT POINT: 1,820
| SUPPORT | RESISTANCE |
| 1,815 | 1,842 |
| 1,810 | 1,850 |
| 1,790 | 1,855 |
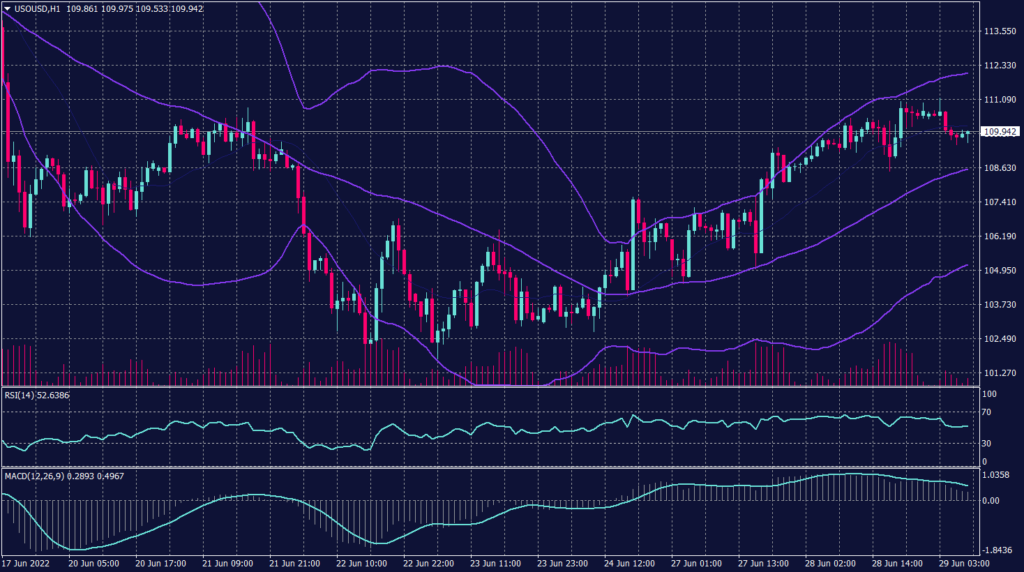
West Texas Crude (USOUSD)
Oil prices fell on Wednesday after rising in the previous three sessions as the market tussled between concerns about the global economy and tight global oil supplies. Brent crude futures for August dropped 84 cents, or 0.7%, to $117.14 a barrel. U.S. West Texas Intermediate (WTI) crude futures slid 0.5% to $111.22 a barrel.
Both contracts rose more than 2% on Tuesday as concerns over tight supplies due to Western sanctions on Russia outweighed fears that demand may slow in a potential future recession.
In the United States, crude inventories are forecast to have fallen for the last two weeks. Meanwhile, the government’s weekly petroleum status report last week was delayed due to a hardware issue. The data for both weeks will be published together today.
Technically:
On the hourly chart, WTI prices show a decrease in volume traded due to the worries about the G-7 decision regarding the Russian sanctions. Meanwhile, WTI shows a corrective movement bouncing from $104 to the resistance of $109.80.
However, the daily chart confirms the high probability of the decline and targets $98 a barrel before any serious gains happens.
PIVOT POINT: 109.80
| SUPPORT | RESISTANCE |
| 108.10 | 111.00 |
| 102.20 | 112.30 |
| 100.00 | 140.00 |
Tags
Open Live Account
Please enter a valid country
No results found
No results found
Please enter a valid email
Please enter a valid verification code
1. 8-16 characters + numbers (0-9) 2. blend of letters (A-Z, a-z) 3. special characters (e.g, !a#S%^&)
Please enter the correct format
Please tick the checkbox to proceed
Please tick the checkbox to proceed
Important Notice
STARTRADER does not accept any applications from Australian residents.
To comply with regulatory requirements, clicking the button will redirect you to the STARTRADER website operated by STARTRADER PRIME GLOBAL PTY LTD (ABN 65 156 005 668), an authorized Australian Financial Services Licence holder (AFSL no. 421210) regulated by the Australian Securities and Investments Commission.
CONTINUEImportant Notice for Residents of the United Arab Emirates
In alignment with local regulatory requirements, individuals residing in the United Arab Emirates are requested to proceed via our dedicated regional platform at startrader.ae, which is operated by STARTRADER Global Financial Consultation & Financial Analysis L.L.C.. This entity is licensed by the UAE Capital Market Authority (CMA) under License No. 20200000241, and is authorised to introduce financial services and promote financial products in the UAE.
Please click the "Continue" button below to be redirected.
CONTINUEError! Please try again.

