








 Web Trader MT5













USDJPY Technical Analysis
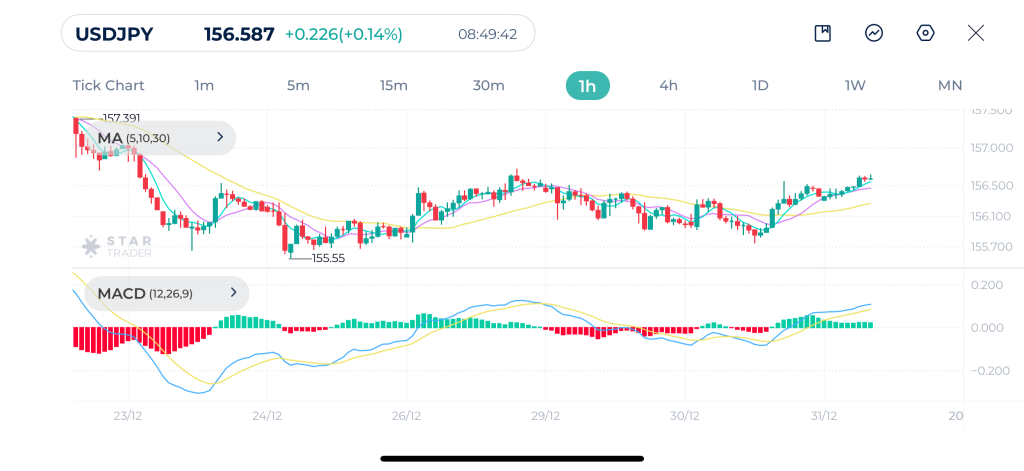
USDJPY is stabilizing after yesterday’s decline and is now forming higher highs and higher lows from the 155.55 support area and is gradually pushing above the short term moving averages. Moving averages MA(5) and MA(10) have crossed above MA(30) on the hourly chart, which suggests improving bullish momentum and growing buyer confidence in the near term.
MACD has crossed into positive territory. This indicates strengthening upside momentum and supports the idea that the recent consolidation has resolved to the upside.
Immediate resistance sits near 156.80–157.00, which aligns with previous intraday highs. A break above this zone would confirm continuation toward higher levels. On the downside, 156.00 now acts as key short-term support. As long as price holds above it, the bullish recovery scenario remains intact.
USDJPY 1H Chart
| Resistance | 156.73 | 157.07 | 157.29 |
| Support | 156.33 | 156.22 | 156.00 |
Gold Technical Analysis
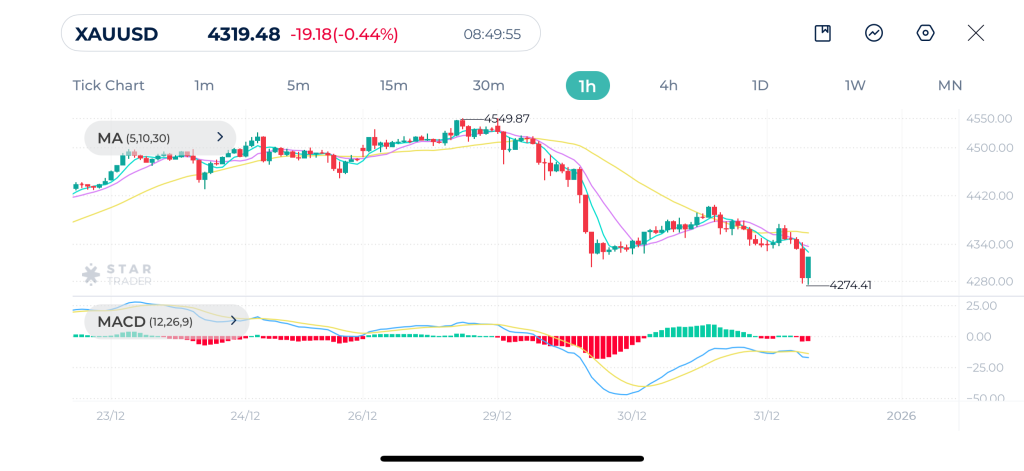
Gold is clearly showing a strong bearish correction after topping near the $4,550 area. Price has aggressively broken below all key moving averages, with the MA(30) now acting as dynamic resistance. The sharp sell-off and inability to hold above prior support zones indicate that bullish momentum has been interrupted.
Technically, the $4,270–$4,300 zone is now a critical support area. If this level holds, gold may attempt a rebound toward $4,350–$4,380 However, a clean break below $4,270 would expose the market to a deeper retracement.
Gold 1H Chart
| Resistance | $4,338 | $4,373 | $4,405 |
| Support | $4,273 | $4,247 | $4,205 |
Nasdaq Technical Analysis
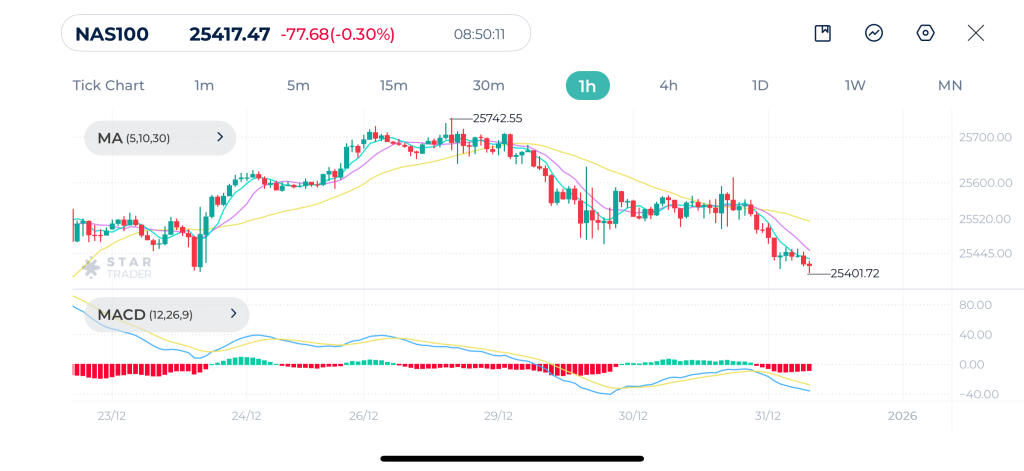
Nasdaq is currently in a short-term corrective phase after failing to sustain prices above the 25,700 resistance area. Price has broken below the short-term moving averages MA(5) and MA(10) and is now trading below the MA(30). The series of lower highs and lower lows over the last sessions confirms weakening upside momentum.
MACD is currently in negative territory, indicating that bearish momentum is still active.
Immediate support is located around 25,400, followed by 25,250, which is a key intraday support area. A break below this zone could open the door for a deeper pullback. On the upside, a sustained reclaim above MA(30) and a bullish MACD crossover would signal a potential return of buyers.
Nasdaq 1H Chart
| Resistance | 25,422 | 25,460 | 25,498 |
| Support | 25,359 | 25,254 | 25,165 |
Tags


Open Live Account
 Email Address
 Phone Number
Important Notice
STARTRADER does not accept any applications from Australian residents.
To comply with regulatory requirements, clicking the button will redirect you to the STARTRADER website operated by STARTRADER PRIME GLOBAL PTY LTD (ABN 65 156 005 668), an authorized Australian Financial Services Licence holder (AFSL no. 421210) regulated by the Australian Securities and Investments Commission.
Important Notice for Residents of the United Arab Emirates
In alignment with local regulatory requirements, individuals residing in the United Arab Emirates are requested to proceed via our dedicated regional platform at startrader.ae, which is operated by STARTRADER Global Financial Consultation & Financial Analysis L.L.C.. This entity is licensed by the UAE Capital Market Authority (CMA) under License No. 20200000241, and is authorised to introduce financial services and promote financial products in the UAE.
Please click the "Continue" button below to be redirected.


