


Gold Technical Analysis
Gold remains under bearish pressure despite the rebound currently developing from the recent low at $4,023. The broader trend remains negative, as the precious metal has fallen dramatically from the $4,515 high and continues to trade well below major resistance levels.
The moving averages have started to flatten, indicating that the previous bearish momentum is weakening. Nevertheless, the near term trend remains bearish because the market is still producing lower highs on the broader timeframe and remains far below the major breakdown zones.
Immediate resistance is located around $4,125, followed by $4,200 and then the stronger resistance zone near $4,270. Support is found at $4,070 and then the major low at $4,023. A break below $4,023 would confirm continuation of the downtrend, while a sustained move above $4,200 would strengthen the case for a larger recovery.
Gold 1H Chart
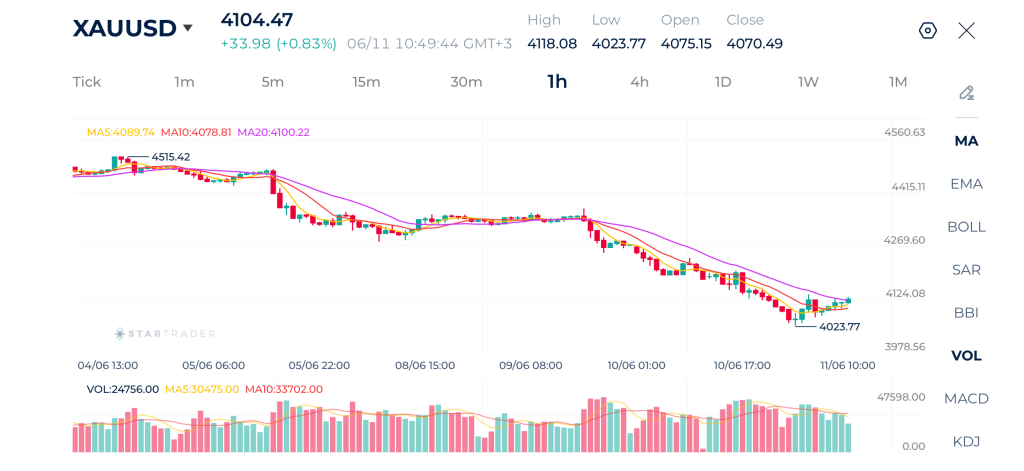
| Resistance | $4,136 | $4,186 | $4,200 |
| Support | $4,051 | $4,023 | $3,954 |
Brent Technical Analysis
Brent crude oil remains in a broader bearish trend despite the rebound that developed from the $91.10 low earlier this week. The recovery toward the $96.80 area initially suggested that buyers were regaining control, but the rally failed to break the previous swing structure and has now been met with aggressive selling.
The moving averages are beginning to roll over again after briefly turning higher. Price is currently trading below both the 5-period and 10-period moving averages and is testing the 20-period moving average around $94.80. The rejection from the $95.80–$96.80 resistance zone is technically important because it coincides with a previous supply area where sellers previously entered the market. As long as Brent remains below that zone, the bearish structure remains intact.
Immediate support is located around $93.60, followed by $92.90 and then the major support zone near $91.10. Resistance is now found at $94.80, followed by $95.80 and then $96.80. Overall, the short-term outlook remains bearish, with sellers currently attempting to resume the broader downtrend.
Brent 1H Chart
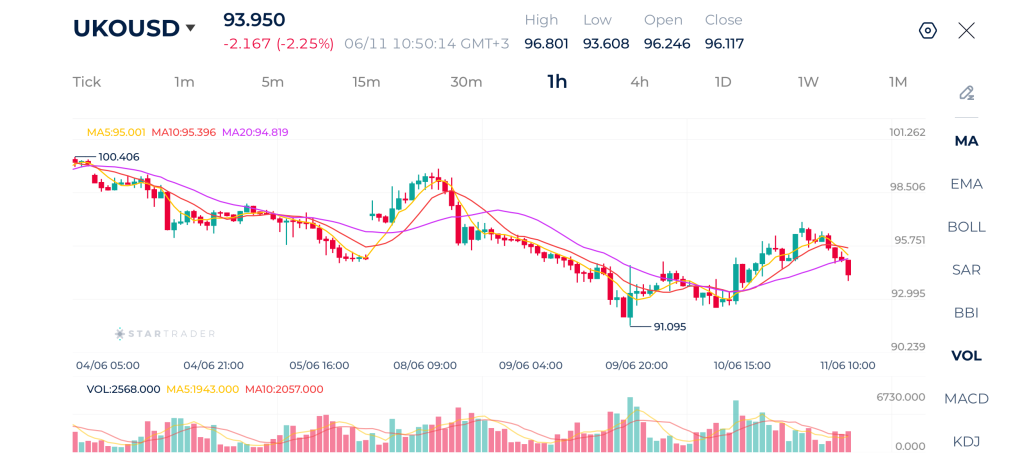
| Resistance | $94.80 | $95.80 | $96.80 |
| Support | $92.30 | $91.10 | $89.60 |
USDJPY Technical Analysis
USDJPY has been steadily climbing over the past several sessions, producing a clear sequence of higher highs and higher lows. The latest move toward 160.58 places the pair near the top of its recent range and highlights persistent dollar strength against the yen.
The moving average structure remains strongly supportive of further gains. Price is trading above the 5-period, 10-period, and 20-period moving averages, while all three averages are sloping upward. This alignment reflects sustained bullish momentum and indicates that buyers continue to dominate the short-term trend.
Immediate resistance is located at 160.58, followed by the psychological 161.00 level. A break above 161.00 could attract additional momentum buying. On the downside, support is found at 160.40, followed by 160.15 and then the stronger support zone near 159.90. The overall outlook remains bullish while price continues to hold above the 20-period moving average.
USDJPY 1H Chart
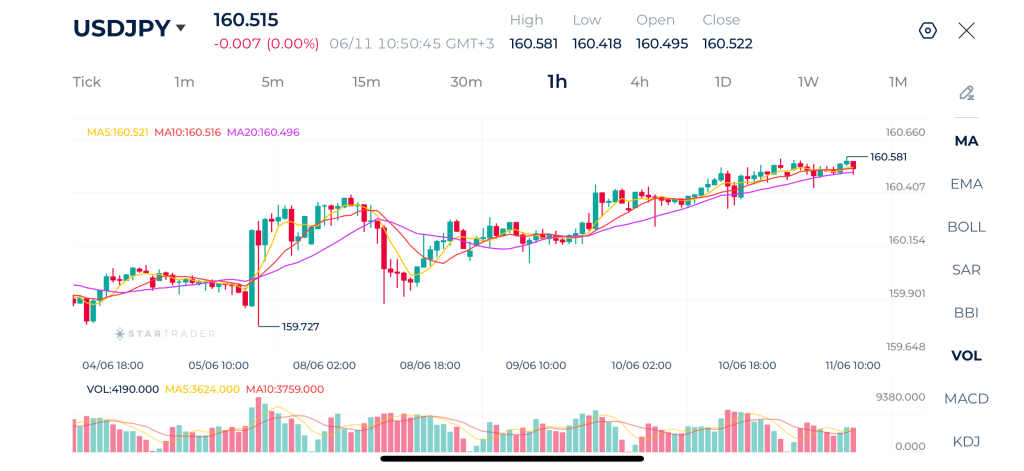
| Resistance | 160.58 | 161.25 | 162.00 |
| Support | 160.44 | 160.32 | 160.00 |
Risk Disclaimer: This material is provided for informational purposes only and does not constitute a recommendation or investment advice. Trading financial instruments on margin involves substantial risk and may not be appropriate for all investors.
Tags
Open Live Account
Please enter a valid country
No results found
No results found
Please enter a valid email
Please enter a valid verification code
1. 8-16 characters + numbers (0-9) 2. blend of letters (A-Z, a-z) 3. special characters (e.g, !a#S%^&)
Please enter the correct format
Please tick the checkbox to proceed
Please tick the checkbox to proceed
Important Notice
STARTRADER does not accept any applications from Australian residents.
To comply with regulatory requirements, clicking the button will redirect you to the STARTRADER website operated by STARTRADER PRIME GLOBAL PTY LTD (ABN 65 156 005 668), an authorized Australian Financial Services Licence holder (AFSL no. 421210) regulated by the Australian Securities and Investments Commission.
CONTINUEImportant Notice for Residents of the United Arab Emirates
In alignment with local regulatory requirements, individuals residing in the United Arab Emirates are requested to proceed via our dedicated regional platform at startrader.ae, which is operated by STARTRADER Global Financial Consultation & Financial Analysis L.L.C.. This entity is licensed by the UAE Capital Market Authority (CMA) under License No. 20200000241, and is authorised to introduce financial services and promote financial products in the UAE.
Please click the "Continue" button below to be redirected.
CONTINUEError! Please try again.

