








 Web Trader MT5













GBPUSD Technical Analysis
GBPUSD is trading in a clear uptrend on the hourly chart, having broken above previous resistance levels and pushed toward the 1.3560 area. The pair has formed a series of higher highs and higher lows, confirming bullish market structure after rebounding from the 1.3400 support zone. Buying momentum appears consistent, with limited downside retracements.
Price action is supported by the moving averages, with GBPUSD trading above the 5, 10, and 30-period moving averages, all of which are now sloping upward. As long as price remains above the 1.3500–1.3480 area, upside risks dominate, with scope for further extension higher.
GBPUSD 1H Chart
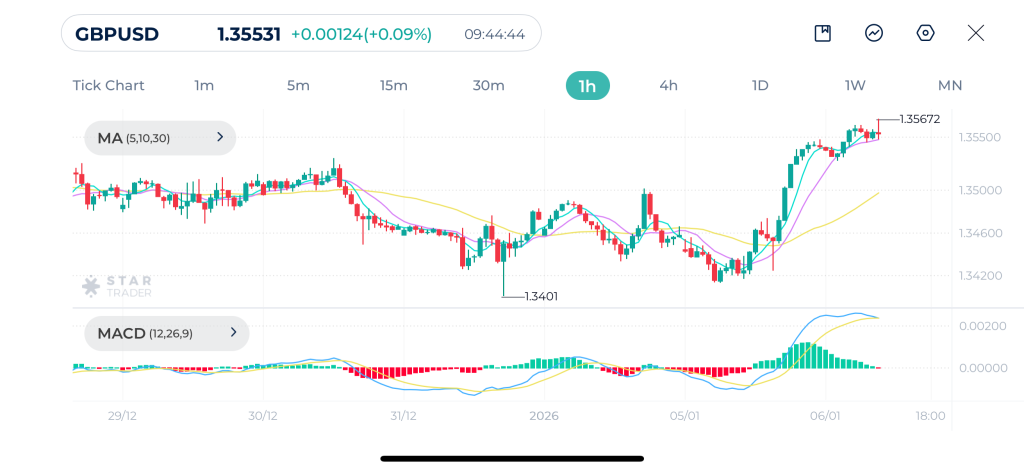
| Resistance | 1.3620 | 1.3654 | 1.3700 |
| Support | 1.3546 | 1.3521 | 1.3483 |
Gold Technical Analysis
Gold resumed its long term uptrend after successfully defending the $4,270 support area. Price has established a sequence of higher lows and higher highs, indicating that buyers remain in control. The current price action shows steady, controlled upside momentum.
Price is firmly above the 5, 10, and 30-period moving averages, with all of them sloping upward. This alignment confirms bullish trend strength and indicates that pullbacks toward the short-term averages are likely to be supported. Immediate resistance is located around $4,500 – $4,550, while the $4,420 – $4,400 zone acts as key dynamic support.
MACD remains in positive territory. As long as MACD holds above the zero line, the broader short-term outlook remains constructive.
Gold 1H Chart
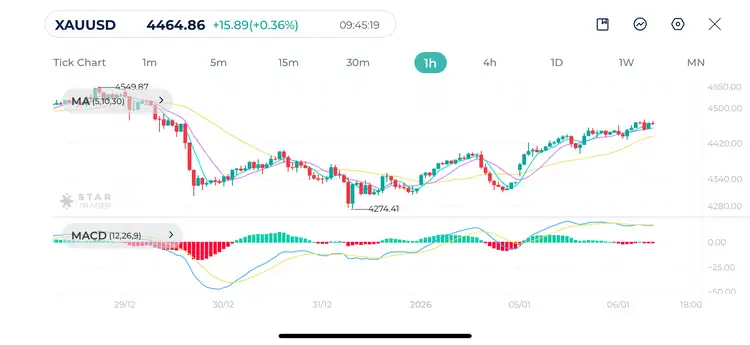
| Resistance | $4,503 | $4,521 | $4,551 |
| Support | $4,427 | $4,410 | $4,395 |
Dow Jones Technical Analysis
Dow Jones has experienced a strong bullish breakout following a prolonged consolidation and decline, with price surging to a new record high near the 49,250 region.
Price is trading well above all key moving averages, with the MA(5) and MA(10) sharply above the 30-period moving average. This bullish structure confirms strong trend momentum. As long as price holds above the 49,000 psychological level, upside continuation toward new highs remains the preferred scenario.
A renewed expansion in MACD would likely accompany the next bullish leg higher.
Dow Jones 1H Chart
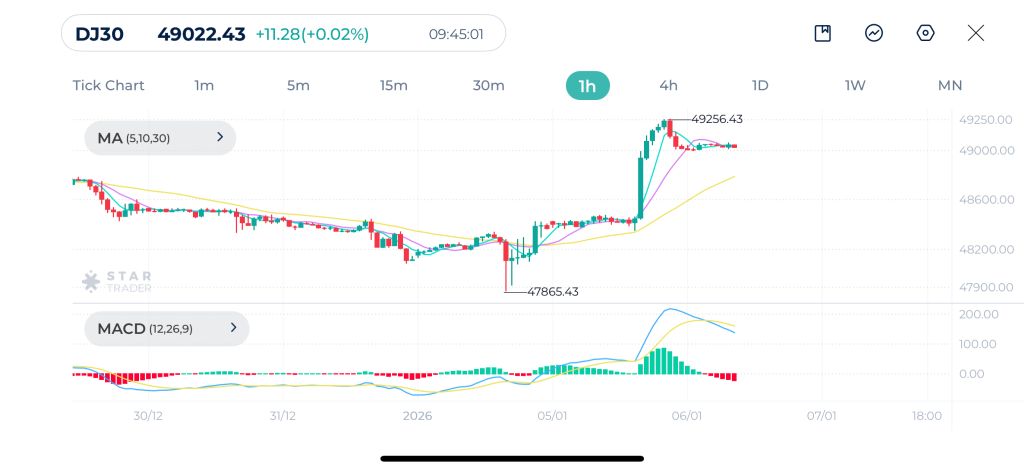
| Resistance | 49,219 | 49,406 | 49,500 |
| Support | 48,909 | 48,765 | 48,573 |
Tags


Open Live Account
 Email Address
 Phone Number
Important Notice
STARTRADER does not accept any applications from Australian residents.
To comply with regulatory requirements, clicking the button will redirect you to the STARTRADER website operated by STARTRADER PRIME GLOBAL PTY LTD (ABN 65 156 005 668), an authorized Australian Financial Services Licence holder (AFSL no. 421210) regulated by the Australian Securities and Investments Commission.
Important Notice for Residents of the United Arab Emirates
In alignment with local regulatory requirements, individuals residing in the United Arab Emirates are requested to proceed via our dedicated regional platform at startrader.ae, which is operated by STARTRADER Global Financial Consultation & Financial Analysis L.L.C.. This entity is licensed by the UAE Capital Market Authority (CMA) under License No. 20200000241, and is authorised to introduce financial services and promote financial products in the UAE.
Please click the "Continue" button below to be redirected.


