


market news summary
Fed minutes are due today;
Crude supply worries rise;
Gold turns 1,850 to support.
U.S. Dollar Index (USDX)
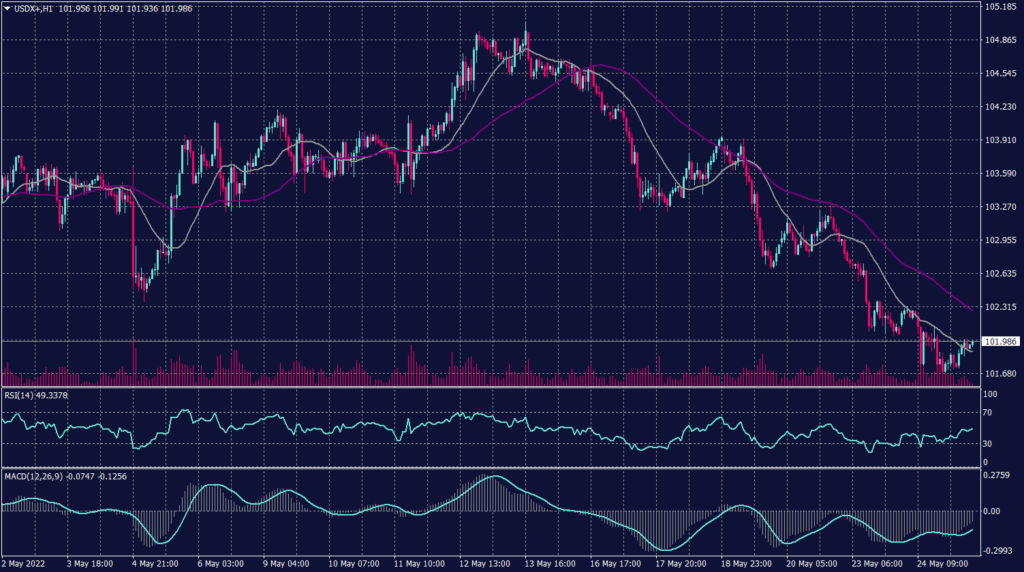
Investors await the monetary policy outlook with worries of a potential recession caused by the tightening of the monetary policies. The minutes from the last Fed meeting will be released later today, investors are expecting more clues on whether the tightening would continue.
Technically:
The U.S. Dollar Index inched up 0.09% to 101.968 breaking its losing streak but remains to trade in a downtrend targeting 101.60 and 101.20. Additionally, the index still trading below the 20 day and 55 day moving average on the daily chart and hourly chart indicating a possibility for a further decline.
Likewise, the index forms a declining pattern on the hourly chart which targets 102.50 unless it closed above the 20 hours moving average. Technical indicators are not providing clear signals which indicate the need to hold until there is a clear direction.
PIVOT POINT: 102.00
| SUPPORT | RESISTANCE |
| 101.60 | 102.60 |
| 101.40 | 103.10 |
| 101.20 | 103.35 |
Euro (EURUSD)
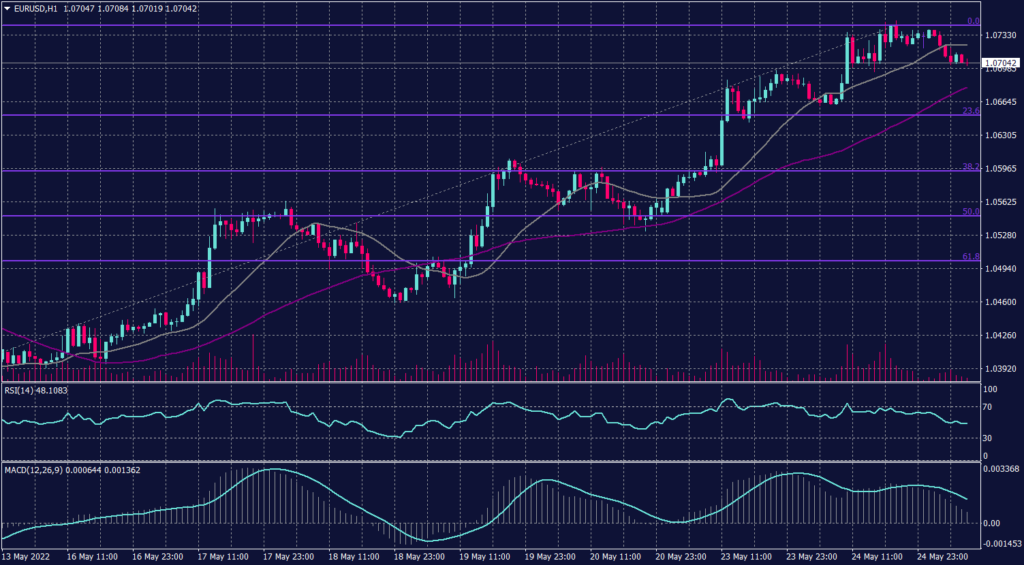
The common currency declined 0.22% to $1.07105 but remained near a month low of $1.0748. European Central Bank President Christine Lagarde’s comments said eurozone interest rates will likely be in positive territory by the end of the third quarter, which gave the euro support.
Lagarde’s comments implied an increase of at least 50 basis points to the deposit rate and triggered speculation of bigger hikes this summer.
Technically:
The European currency fell after touching the resistance of 1.0750 and kept trading above the support of 1.0610 and is expected to move in a semi-horizontal trend. However, Fibonacci retracement shows a solid resistance around 1.0610 and the possibility of a retreat towards 1.0560. Technical indicators show a higher possibility to fall than continuing the uptrend, however, the moving average on the daily chart remains above the current price levels.
PIVOT POINT: 1.0710
| SUPPORT | RESISTANCE |
| 1.0610 | 1.0740 |
| 1.0550 | 1.0840 |
| 1.0510 | 1.0910 |
Sterling Pounds (GBPUSD)
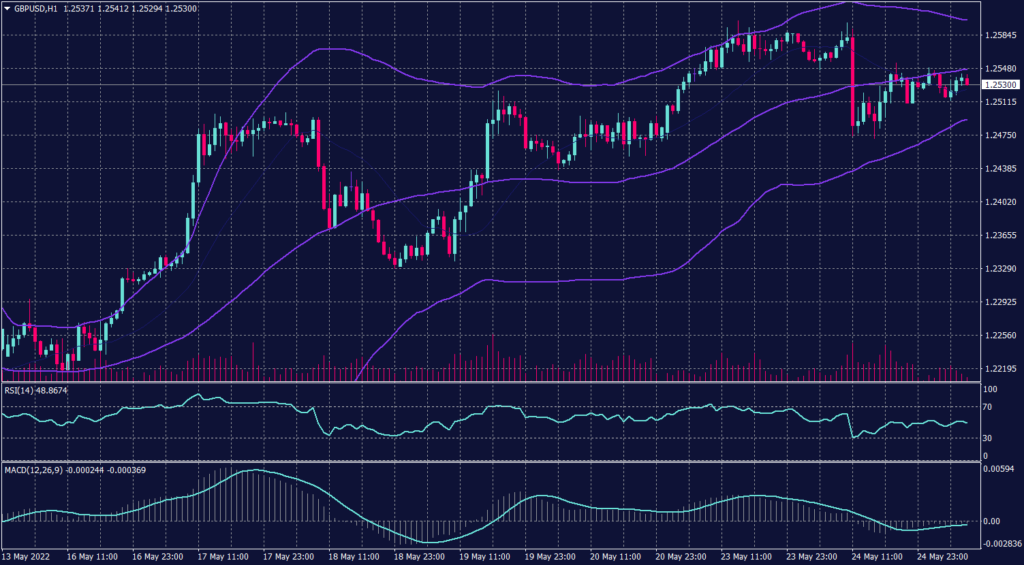
The Cable remains under pressure around the resistance level of 1.2550 on both the daily and hourly charts. However, the sterling pound remains inside the declining channel on the daily time frame.
The price chart is touching the upper band of Bollinger Bands indicators, which signals a higher possibility to retreat towards 1.2560 on the hourly chart and 1.2460 on the daily chart.
Meanwhile, the pair shows a possibility to move on the hourly time frame between 1.2440 and 1.2500. The RSI and MACD are showing signals for a further decline, while price action retains the reading of 1.2100 on the daily time frame.
PIVOT POINT: 1.2565
| SUPPORT | RESISTANCE |
| 1.2500 | 1.2622 |
| 1.2440 | 1.2695 |
| 1.2350 | 1.2750 |
Japanese Yen (USDJPY)
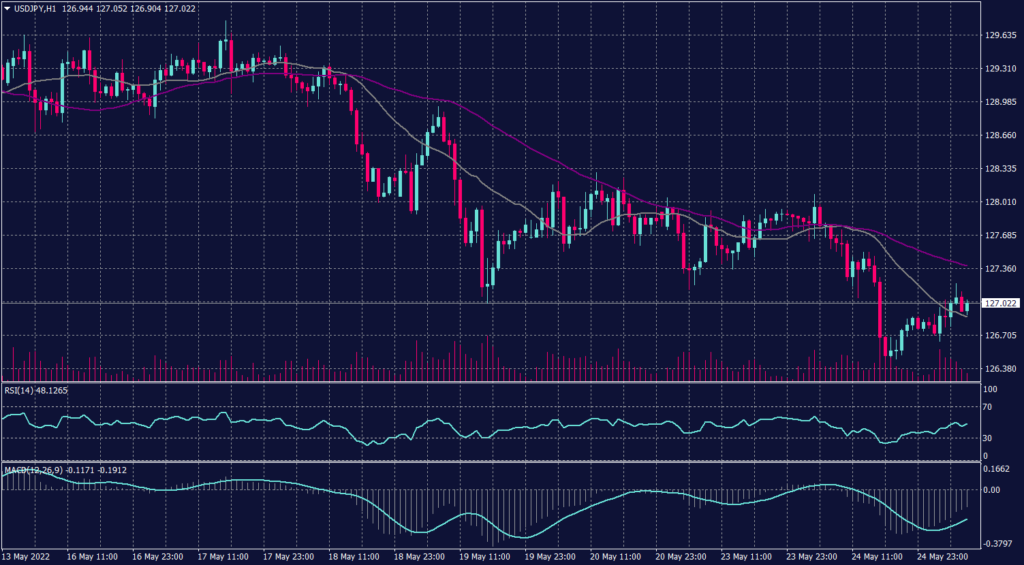
The Japanese Yen retains its momentum against the greenback while cements its trend after touching its best rate in a month at 127.00.
Meanwhile, after breaking below 128.70 the pair is confirming the downtrend on the hourly chart and signaling a higher possibility of the continuation on the daily chart. While the moving average reading indicates that the current level is critical resistance, MACD and RSI readings remain neutral.
PIVOT POINT: 127.60
| SUPPORT | RESISTANCE |
| 127.00 | 128.70 |
| 126.60 | 129.10 |
| 126.20 | 129.45 |
Spot Gold (XAUUSD)
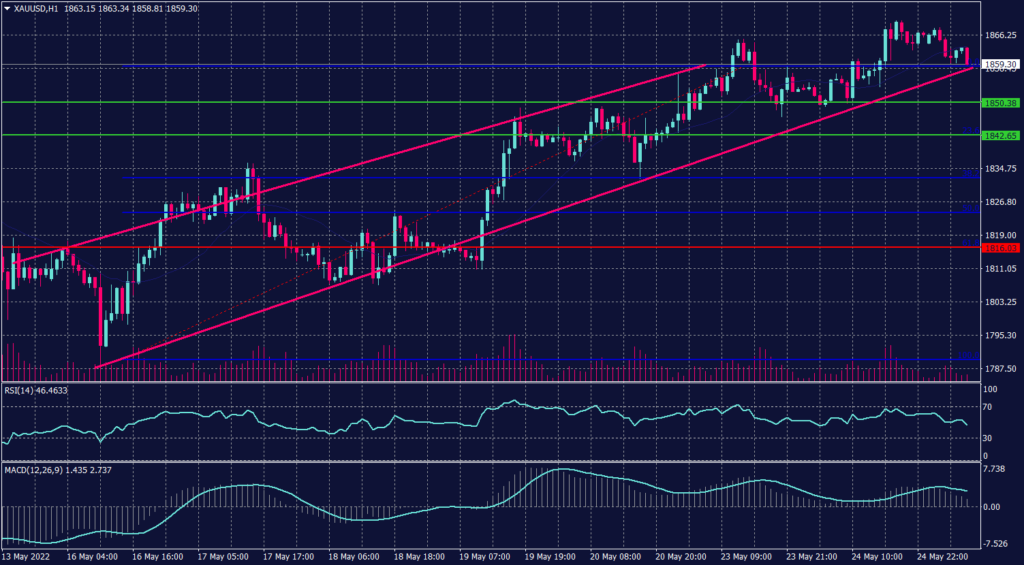
The Federal Reserve continues its fight against 40-year-high inflation with an expected series of big interest-rate hikes. Additionally, higher short-term U.S. interest rates raise the opportunity cost of holding non-yielding bullion.
Benchmark 10-year U.S. Treasury yields firmed after a decline during the previous session to a one-month low, pressuring demand for zero-yield bullion.
Technically:
Gold prices dipped slightly during the early trades, retreating from a two-week high at 1,869.49. However, spot gold may hover above the support at $1,850 per ounce and retest a resistance at $1,875.
The yellow metal is expected to hover above the support of 1,850 and is likely to break the five-day gaining streak. However, the chart remains solidifying the support at 1,850. Meanwhile, the RSI indicates that the metal is overbought while MACD is close to the intersection point.
PIVOT POINT: 1,850
| SUPPORT | RESISTANCE |
| 1,810 | 1,875 |
| 1,800 | 1,895 |
| 1,792 | 1,905 |
West Texas Crude (USOUSD)
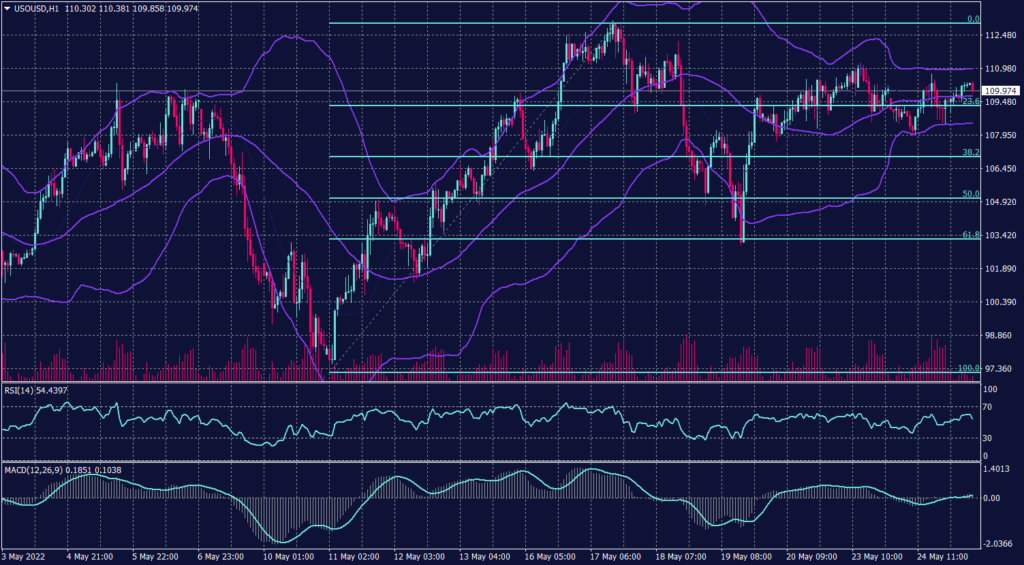
Crude oil continued the gains fueled by tight supplies and the prospect of rising demand. Additionally, Global crude supplies continue to tighten as buyers avoid oil from Russia amid sanctions following its invasion of Ukraine. Furthermore, Brent crude futures gained 1.2% to $114.94 while WTI futures rose 1.2% to $111.12 a barrel.
Technically:
West Texas crude is showing an uptrend on the hourly chart amid the Chinese decision to increase the strategic reserves. Meanwhile, on the hourly chart, WTI has formed support above $109 to weaken the resistance at $111.30.
Despite the heavy buying momentum, technical indicators show a possibility to see crude oil hovering around $109. However, Fibonacci retracement and 20 periods moving average show a higher probability of continuing climbing.
PIVOT POINT: 109.70
| SUPPORT | RESISTANCE |
| 107.10 | 111.30 |
| 105.75 | 112.75 |
| 104.30 | 115.00 |
Tags
Open Live Account
Please enter a valid country
No results found
No results found
Please enter a valid email
Please enter a valid verification code
1. 8-16 characters + numbers (0-9) 2. blend of letters (A-Z, a-z) 3. special characters (e.g, !a#S%^&)
Please enter the correct format
Please tick the checkbox to proceed
Please tick the checkbox to proceed
Important Notice
STARTRADER does not accept any applications from Australian residents.
To comply with regulatory requirements, clicking the button will redirect you to the STARTRADER website operated by STARTRADER PRIME GLOBAL PTY LTD (ABN 65 156 005 668), an authorized Australian Financial Services Licence holder (AFSL no. 421210) regulated by the Australian Securities and Investments Commission.
CONTINUEImportant Notice for Residents of the United Arab Emirates
In alignment with local regulatory requirements, individuals residing in the United Arab Emirates are requested to proceed via our dedicated regional platform at startrader.ae, which is operated by STARTRADER Global Financial Consultation & Financial Analysis L.L.C.. This entity is licensed by the UAE Capital Market Authority (CMA) under License No. 20200000241, and is authorised to introduce financial services and promote financial products in the UAE.
Please click the "Continue" button below to be redirected.
CONTINUEError! Please try again.

