


The Fed signaled it has no plans to ease on its path of monetary tightening. The move pushed the dollar to a 20-year peak, and also drove up short-term Treasury yields. While Fed’s hawkish statement interrupted the markets, the employment figures are on the way with low expectations.
U.S. Dollar Index (USDX)
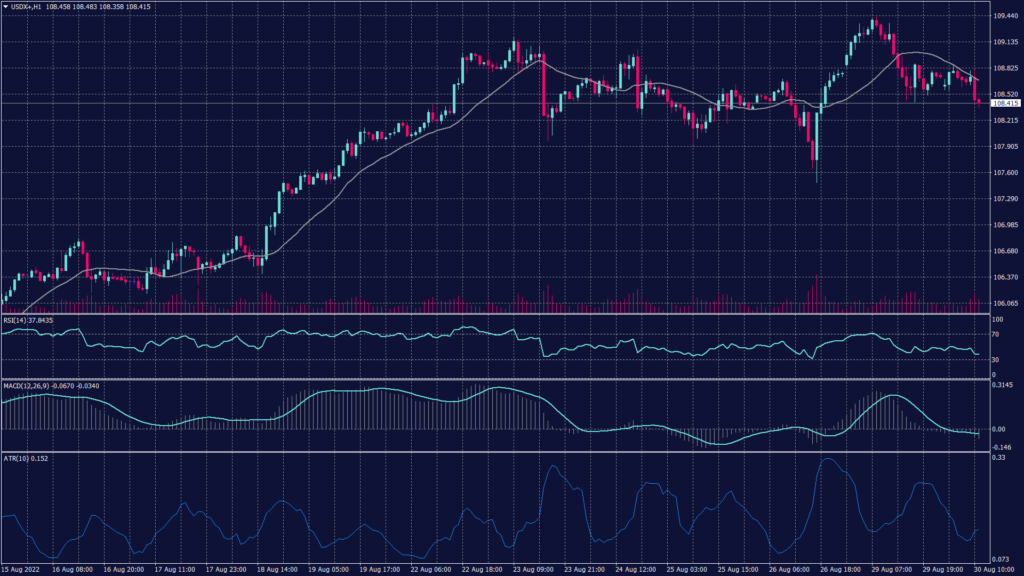
The dollar struggled to regain momentum on Tuesday after being beaten back from a two-decade high. Meanwhile, bets for the Fed to raise 75 bps are increasing. Market participants will closely watch the monthly U.S. jobs figures due on Friday. Meanwhile, the dollar index stood at 108.72 in the Asian session, after dropping back from its two decades high at 109.48.
Technically, the index dropped this morning from 108.70 to 108.40 in one hourly candle to test the support at 108.40 for the third time since the last session. Furthermore, the daily chart remains positive targeting 109.80 and 110.20 if the resistance at 109.40 was penetrated. However, the hourly chart shows a slight slowdown and decline over the last few hours in the chart.
Pivot Point: 108.40
| SUPPORT | RESISTANCE |
| 108.10 | 108.80 |
| 108.00 | 109.10 |
| 107.90 | 109.40 |
Euro (EURUSD)
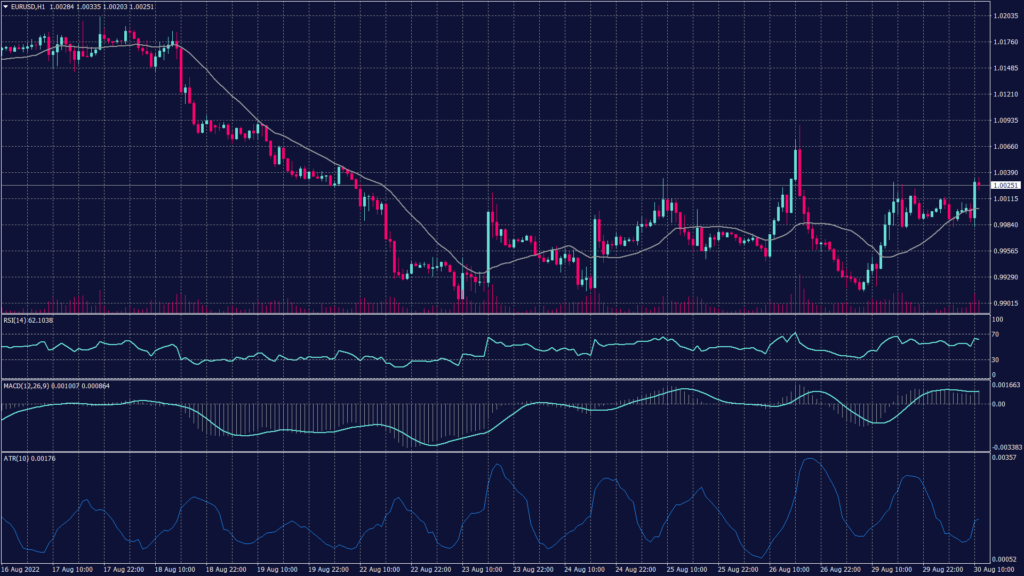
The Euro skyrocketed as market participants began ramping up bets for a super-sized 75-basis-point interest rate increase by the European Central Bank while paring the odds for one by the U.S. Federal Reserve. Eurozone consumer confidence data for August are due later in the session, but most eyes will be on Friday’s monthly U.S. jobs report, and markets may not like a strong number if it supports the basis for a continuation of aggressive interest rate hikes.
The EURUSD pair bounced up towards the resistance 1.0033 to fluctuate between the Fibonacci levels of 23.6 and 0.0 (1.0005 and 1.0033) which shows a possible break out to 1.0055. Technical indicators show a possibility for the continuation of the downtrend regardless of the RSI neutral level at the daily chart and remain to pressure the current levels towards 0.9850.
Pivot Point: 1.0023
| SUPPORT | RESISTANCE |
| 1.0005 | 1.0035 |
| 0.9985 | 1.0055 |
| 0.9973 | 1.0085 |
Spot Gold (XAUUSD)
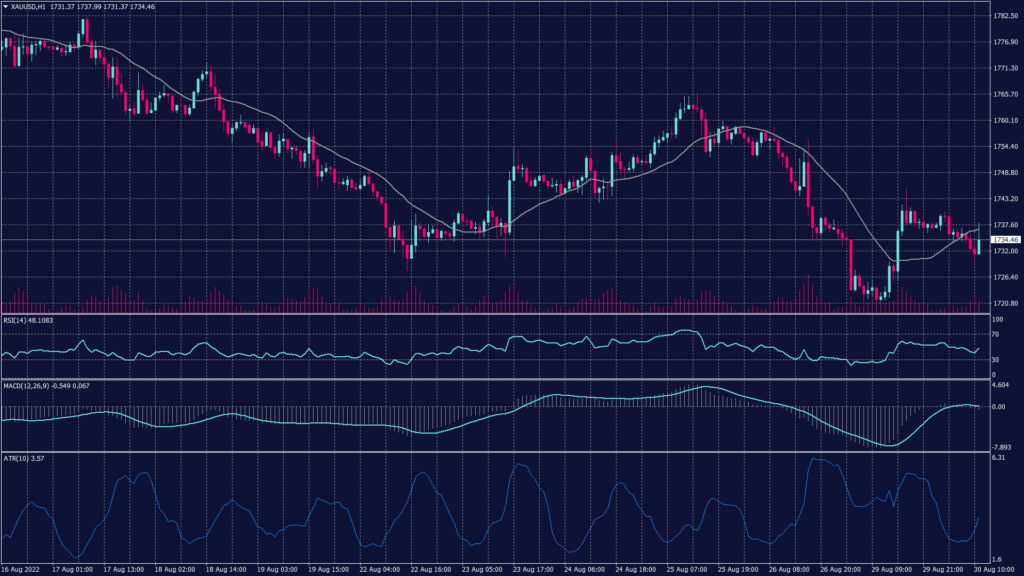
Gold prices recovered slightly on Tuesday, taking some relief as the dollar retreated from a 20-year peak, although hawkish signals from the Federal Reserve still weighed on the market.
Metal markets are now looking at upcoming U.S. payroll data this week. Strength in the jobs market is likely to give the Fed much more room to hike interest rates aggressively. Meanwhile, markets are pricing in a greater chance of a 75 basis point hike by the central bank in September. Spot gold rose 0.1% to $1,738.55 an ounce, while gold futures broke above $1,750 an ounce with a similar gain.
Spot gold remains negative on both the daily and hourly time frames, but it shows a horizontal trend on the hourly chart. Meanwhile, the daily chart shows a sharper and clearer downtrend targeting levels near $1,700 per ounce.
Pivot Point: 1,733
| SUPPORT | RESISTANCE |
| 1,710 | 1,735 |
| 1,700 | 1,740 |
| 1,680 | 1,742 |
West Texas Crude (USOUSD)
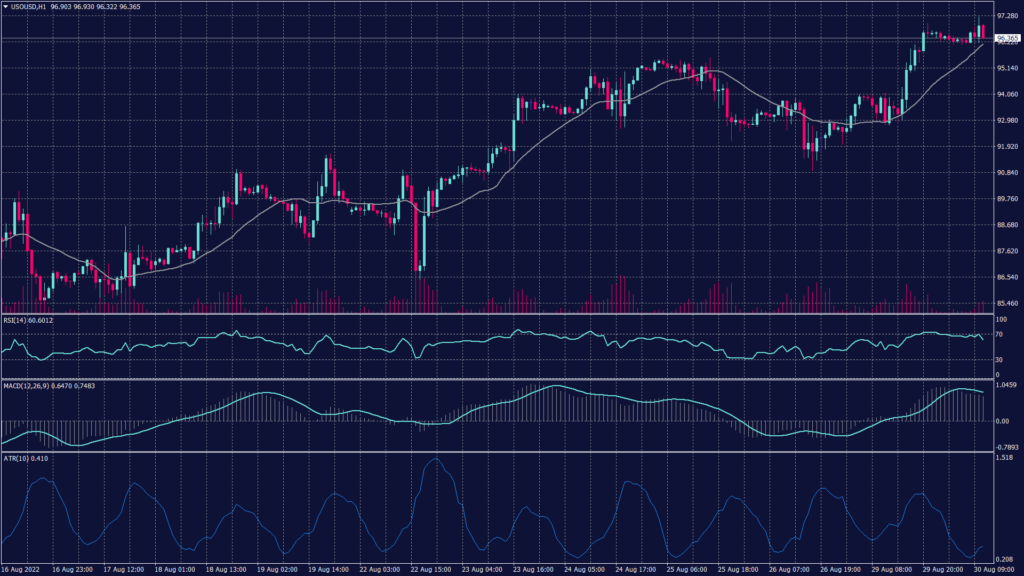
Oil prices dipped on Tuesday, paring some gains from the previous session, as the market feared that more aggressive interest rates hike from central banks may lead to a global economic slowdown and soften fuel demand. Brent crude futures for October settlement dropped 0.5%, to $104.53 a barrel while WTI was at $96.86 a barrel, down 0.1%, following a 4.2% rise in the previous session.
WTI rebounded from the support at 93.20 reaching above $94.50 per barrel and rising. However, the overall trend remains negative on the daily time frame unless prices broke above $96.20 per barrel which is the neckline of the double bottom on the daily chart.
Pivot Point: 95.00
| SUPPORT | RESISTANCE |
| 92.75 | 95.50 |
| 91.80 | 96.50 |
| 90.95 | 97.80 |
Tags
Open Live Account
Please enter a valid country
No results found
No results found
Please enter a valid email
Please enter a valid verification code
1. 8-16 characters + numbers (0-9) 2. blend of letters (A-Z, a-z) 3. special characters (e.g, !a#S%^&)
Please enter the correct format
Please tick the checkbox to proceed
Please tick the checkbox to proceed
Important Notice
STARTRADER does not accept any applications from Australian residents.
To comply with regulatory requirements, clicking the button will redirect you to the STARTRADER website operated by STARTRADER PRIME GLOBAL PTY LTD (ABN 65 156 005 668), an authorized Australian Financial Services Licence holder (AFSL no. 421210) regulated by the Australian Securities and Investments Commission.
CONTINUEImportant Notice for Residents of the United Arab Emirates
In alignment with local regulatory requirements, individuals residing in the United Arab Emirates are requested to proceed via our dedicated regional platform at startrader.ae, which is operated by STARTRADER Global Financial Consultation & Financial Analysis L.L.C.. This entity is licensed by the UAE Capital Market Authority (CMA) under License No. 20200000241, and is authorised to introduce financial services and promote financial products in the UAE.
Please click the "Continue" button below to be redirected.
CONTINUEError! Please try again.

