








 Web Trader MT5









Gold Technical Analysis
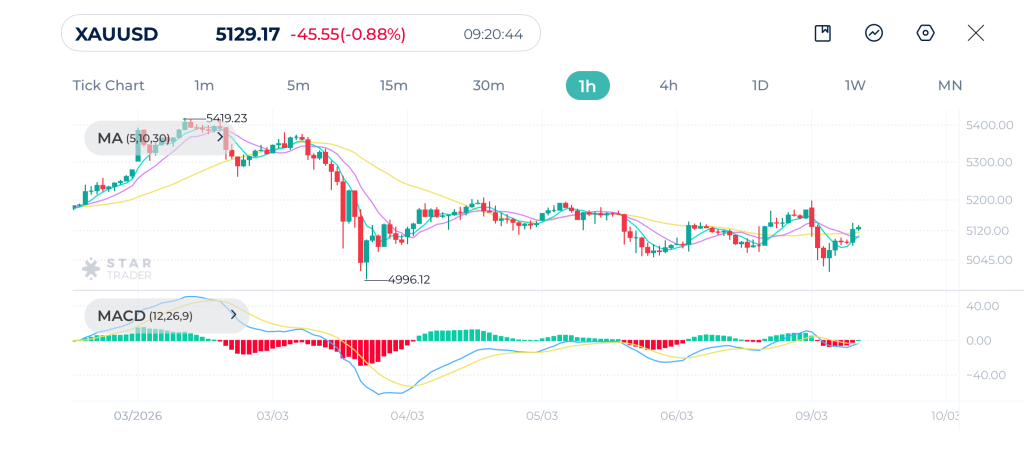
Gold is mostly moving sideways. Despite geopolitical instability, the strengthening USD is making Gold expensive for foreign buyers, capping its upside.
The precious metal is currently hovering just above the $5,000 psychological floor. Failure to hold the $5,020–$5,030 support zone could trigger a deeper correction toward $4,894.
MACD is currently near neutral around the zero line, suggesting a period of indecision before the next major move.
While the long term on gold remains bullish, in the short term, prices are likely to continue fluctuating due to the USD strength. A break above the next major resistance level of $5,200 would indicate further upward movement towards $5,300 level. On the downside, breaking below $5,000 with a daily closure is a warning sign of further declines.
Gold 1H Chart
| Resistance | $5,148 | $5,175 | $5,200 |
| Support | $5,081 | $5,050 | $5,014 |
Dow Jones Technical Analysis
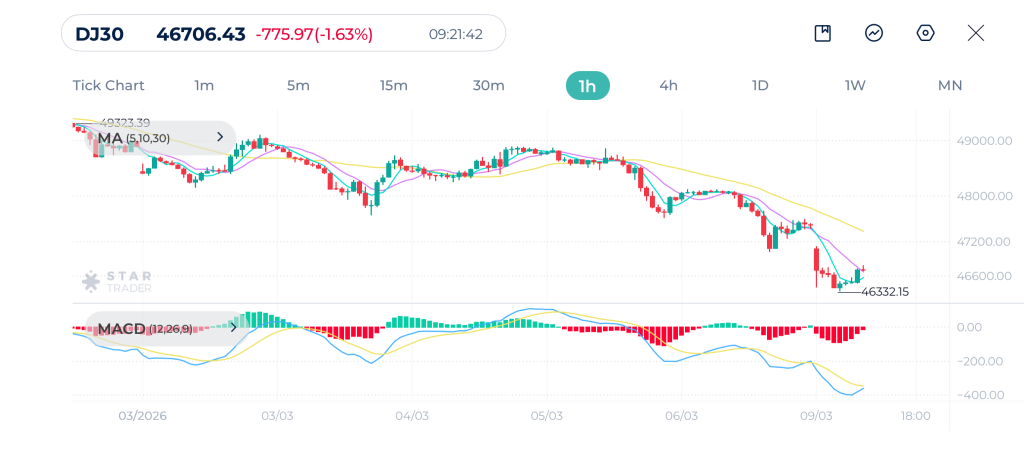
Dow Jones has broken below major support levels that had held since early 2026. The index closed last week below the 48,000 mark and is currently testing lower support zones. The trend is strongly bearish on the hourly chart.
The three main moving averages MA(5), MA(10), and MA(30) are in bearish alignment. The 30-period moving average is likely to continue acting as a resistance level.
MACD shows oversold conditions. While this might invite a temporary relief bounce, the overall structure is heavily weighed down by stagflation fears.
If the current slide continues, the next major support zone sits at 45,000. Immediate resistance for any recovery is located at 47,200.
Dow Jones 1H Chart
| Resistance | 46,780 | 47,000 | 47,570 |
| Support | 46,300 | 45,982 | 45,349 |
US Dollar Index Technical Analysis
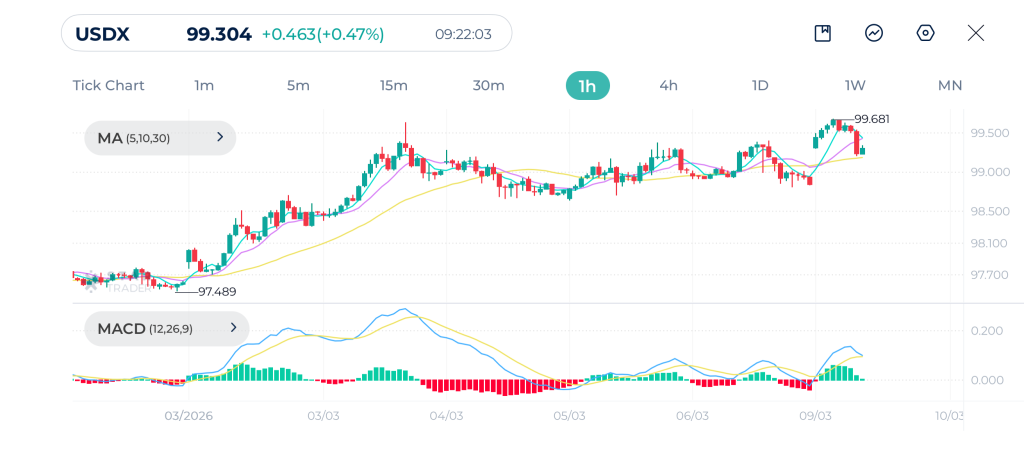
The US Dollar is currently trading at a 14-week high, reaching levels not seen since November 2025. It’s showing a strong recovery after a period of consolidation. Price is trading above its primary Moving Averages (MA), signaling a bullish trend. Holding above the 30-period moving average is a positive sign and could push the index towards 100.000 psychological level.
MACD line has crossed above the signal line and is moving higher into positive territory.
The 1 hour chart indicates bullish momentum. Closing above the recent swing high of 99.68 will likely help to push the index above 100.00 However, a break below the uptrend could push prices down below 99.00 level.
DXY 1H Chart
| Resistance | 99.53 | 99.69 | 100.00 |
| Support | 99.16 | 98.78 | 98.46 |
Risk Disclaimer: This material is provided for informational purposes only and does not constitute a recommendation or investment advice. Trading financial instruments on margin involves substantial risk and may not be appropriate for all investors.
Tags


Open Live Account
 Email Address
 Phone Number
Important Notice
STARTRADER does not accept any applications from Australian residents.
To comply with regulatory requirements, clicking the button will redirect you to the STARTRADER website operated by STARTRADER PRIME GLOBAL PTY LTD (ABN 65 156 005 668), an authorized Australian Financial Services Licence holder (AFSL no. 421210) regulated by the Australian Securities and Investments Commission.
Important Notice for Residents of the United Arab Emirates
In alignment with local regulatory requirements, individuals residing in the United Arab Emirates are requested to proceed via our dedicated regional platform at startrader.ae, which is operated by STARTRADER Global Financial Consultation & Financial Analysis L.L.C.. This entity is licensed by the UAE Capital Market Authority (CMA) under License No. 20200000241, and is authorised to introduce financial services and promote financial products in the UAE.
Please click the "Continue" button below to be redirected.


