








 Web Trader MT5











Brent Technical Analysis
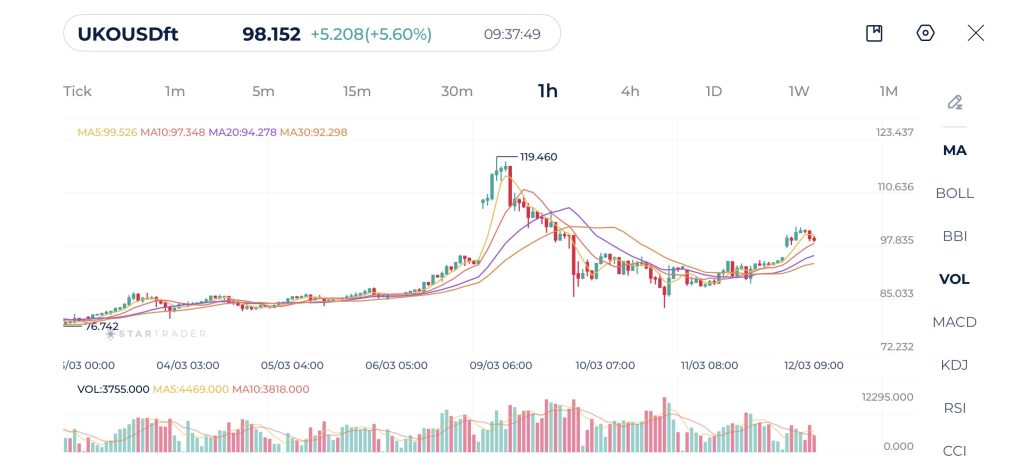
Brent crude oil is currently trading around $98.15, following a strong bullish rally that lifted prices sharply from the mid-80s region to above $110 level.
The moving averages illustrate this transition clearly. During the rally, the MA(5) and MA(10) remained strongly above the longer averages, confirming the bullish trend.
Volume behavior confirms the presence of strong activity during both the rally and the subsequent correction. The decline from the peak was accompanied by increased selling volume, indicating profit taking and a temporary shift in sentiment.
From a technical perspective, $100 remains the nearest resistance level, as it represents a psychological barrier and the upper boundary of the current consolidation. A break above this level could trigger a move toward $105 and possibly $110. On the downside, $95 acts as immediate support, while a deeper decline could target the $90–$92 zone, which represents a major support area formed during the earlier consolidation.
Brent 1H Chart
| Resistance | $98.20 | $99.23 | $100.00 |
| Support | $96.55 | $95.40 | $94.71 |
S&P 500 Technical Analysis
The S&P 500 is currently trading near 6,725–6,800 after experiencing a strong decline that pushed the index down to a significant low around 6,577. From that level, the market staged a sharp recovery, forming a V-shaped rebound that carried prices back toward the 6,800 region, where the market is now consolidating.
The moving averages show that the short term trend initially turned bullish during the rebound, as the MA(5) and MA(10) crossed above the MA(20) and MA(30). However, the recent price action shows the averages starting to compress again, indicating that the market may be entering a sideways consolidation phase.
Volume analysis shows strong activity during the initial selloff and during the rebound from the 6,577 low, which confirms that the recovery had meaningful participation from buyers.
Technically, the 6,800–6,850 area represents the main resistance zone, as it corresponds to the recent consolidation highs and the area where the prior breakdown began. A breakout above this region could allow the index to move toward 6,900 and potentially back to 7,000. On the downside, 6,700 acts as immediate support, while 6,600 remains the key support level, marking the base of the recent rebound.
S&P 500 1H Chart
| Resistance | 6,760 | 6,816 | 6,844 |
| Support | 6,700 | 6,678 | 6,636 |
Gold Technical Analysis
Gold is currently trading around $5,160–$5,200, following a sharp decline from the $5,335 region earlier in the mponth that pushed prices down toward a significant support zone below $5,000.
Looking at the moving averages, the short term averages MA(5) and MA(10) have crossed above the longer averages, MA(20) and MA(30). However, the averages remain relatively close to each other, which indicates the market is still consolidating.
Volume data also supports the idea of stabilization. During the initial selloff, volume expanded significantly, indicating strong selling pressure. Since the recovery began, volume has been more balanced, suggesting that aggressive selling has subsided and buyers are gradually stepping in.
From a technical standpoint, $5,200–$5,220 represents the nearest resistance zone, where price has recently stalled multiple times. A break above this level could open the path toward $5,250 and possibly $5,300. On the downside, $5,150 acts as immediate support, while $5,050–$5,000 remains the key structural support zone that previously triggered the rebound.
Gold 1H Chart
| Resistance | $5,200 | $5,240 | $5,290 |
| Support | $5,124 | $5,088 | $5,050 |
Risk Disclaimer: This material is provided for informational purposes only and does not constitute a recommendation or investment advice. Trading financial instruments on margin involves substantial risk and may not be appropriate for all investors.
Tags


Open Live Account
 Email Address
 Phone Number
Important Notice
STARTRADER does not accept any applications from Australian residents.
To comply with regulatory requirements, clicking the button will redirect you to the STARTRADER website operated by STARTRADER PRIME GLOBAL PTY LTD (ABN 65 156 005 668), an authorized Australian Financial Services Licence holder (AFSL no. 421210) regulated by the Australian Securities and Investments Commission.
Important Notice for Residents of the United Arab Emirates
In alignment with local regulatory requirements, individuals residing in the United Arab Emirates are requested to proceed via our dedicated regional platform at startrader.ae, which is operated by STARTRADER Global Financial Consultation & Financial Analysis L.L.C.. This entity is licensed by the UAE Capital Market Authority (CMA) under License No. 20200000241, and is authorised to introduce financial services and promote financial products in the UAE.
Please click the "Continue" button below to be redirected.


