


Brent Technical Analysis
Oil is showing strong bullish momentum, supported by a clear sequence of higher highs and higher lows. Price has recently broken above the key resistance near $108.50 and extended gains toward $110.30, confirming continuation of the uptrend.
The moving averages are well aligned in a bullish structure, with price trading comfortably above them, indicating sustained buying pressure. Pullbacks remain shallow and quickly bought.
As long as price holds above the $108.50–$109.00 support zone, the bullish trend remains intact, with potential for further upside toward $111.00 and possibly higher. A break below $108.50 would be the first sign of weakening momentum, but for now, buyers remain firmly in control.
Brent 1H Chart
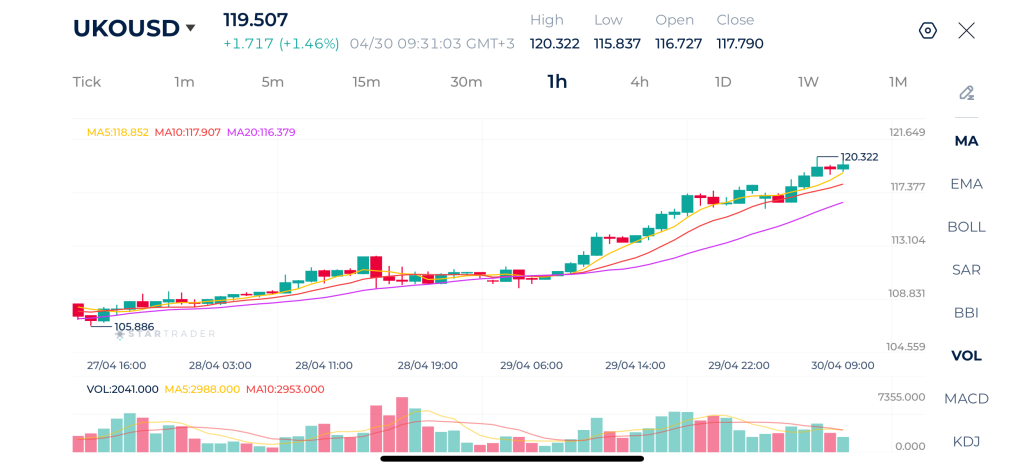
| Resistance | $120.23 | $122.68 | $124.00 |
| Support | $117.20 | $115.28 | $113.00 |
Gold Technical Analysis
Gold is still technically in a short-term downtrend, but the momentum of the decline is clearly slowing. After a sharp sell-off that pushed price toward the $4,555 area, the market has entered a consolidation phase, forming a base with slightly higher lows.
Price is hovering around the 10-period and 20-period moving averages on the hourly chart, suggesting a transition from strong bearish momentum into a more neutral or corrective phase. This indicates that selling pressure is weakening, and buyers are beginning to step in cautiously.
If gold manages to hold above the $4,550–$4,560 support zone and break above $4,585–$4,600, it could trigger a stronger recovery toward $4.620 and beyond. However, if the price fails to sustain this stabilization and breaks below $4,550 again, the broader downtrend could resume with further downside potential.
Gold 1H Chart
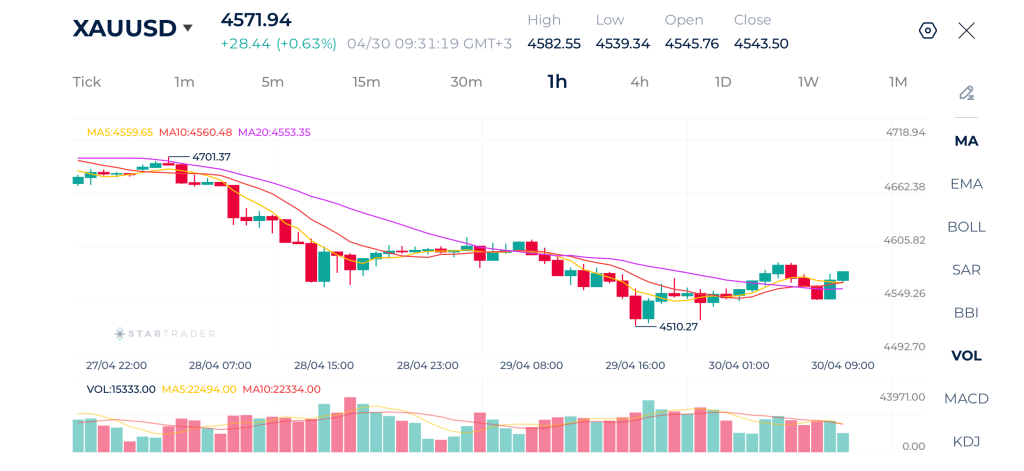
| Resistance | $4,605 | $4,662 | $4,4700 |
| Support | $4,510 | $4,465 | $4,400 |
EURUSD Technical Analysis
EURUSD remains under clear short-term bearish pressure, with price action forming a sequence of lower highs and lower lows. After failing to hold above the 1.1750 resistance area, the pair has steadily declined and is now trading below both the 10-period and 20-period moving averages on the hourly chart, reinforcing the negative bias.
Recent price action shows weak recovery attempts, with bullish candles lacking follow through, indicating that buyers are not strong enough to reverse the trend.
The recent low around 1.1655 is acting as immediate support, and a break below this level could accelerate losses toward 1.1640 and potentially 1.1620. On the upside, any recovery is likely to face resistance around 1.1675–1.1695, and only a sustained move above 1.1700 would begin to challenge the current bearish structure.
EURUSD 1H Chart
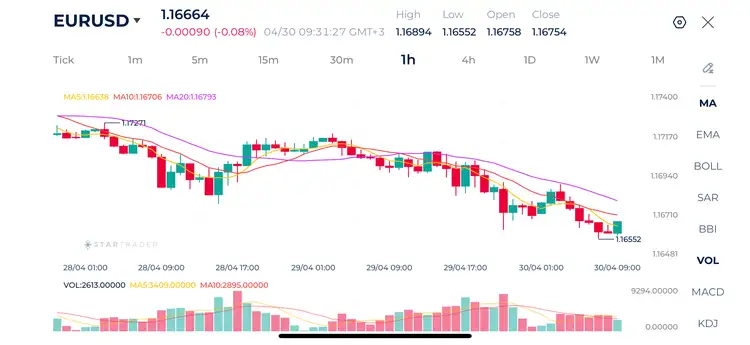
| Resistance | 1.1694 | 1.1727 | 1.1788 |
| Support | 1.1628 | 1.1592 | 1.1553 |
Risk Disclaimer: This material is provided for informational purposes only and does not constitute a recommendation or investment advice. Trading financial instruments on margin involves substantial risk and may not be appropriate for all investors.
Tags
Open Live Account
Please enter a valid country
No results found
No results found
Please enter a valid email
Please enter a valid verification code
1. 8-16 characters + numbers (0-9) 2. blend of letters (A-Z, a-z) 3. special characters (e.g, !a#S%^&)
Please enter the correct format
Please tick the checkbox to proceed
Please tick the checkbox to proceed
Important Notice
STARTRADER does not accept any applications from Australian residents.
To comply with regulatory requirements, clicking the button will redirect you to the STARTRADER website operated by STARTRADER PRIME GLOBAL PTY LTD (ABN 65 156 005 668), an authorized Australian Financial Services Licence holder (AFSL no. 421210) regulated by the Australian Securities and Investments Commission.
CONTINUEImportant Notice for Residents of the United Arab Emirates
In alignment with local regulatory requirements, individuals residing in the United Arab Emirates are requested to proceed via our dedicated regional platform at startrader.ae, which is operated by STARTRADER Global Financial Consultation & Financial Analysis L.L.C.. This entity is licensed by the UAE Capital Market Authority (CMA) under License No. 20200000241, and is authorised to introduce financial services and promote financial products in the UAE.
Please click the "Continue" button below to be redirected.
CONTINUEError! Please try again.

