


market news summary
The dollar was set for its biggest weekly drop in nearly four months. Bitcoin is moving horizontally as investors’ crypto appetite decreases. Oil prices dipped on Friday but stayed near a two-month high, while market participants expect OPEC+ to stick to last year’s oil production deal.
U.S. Dollar Index (USDX)
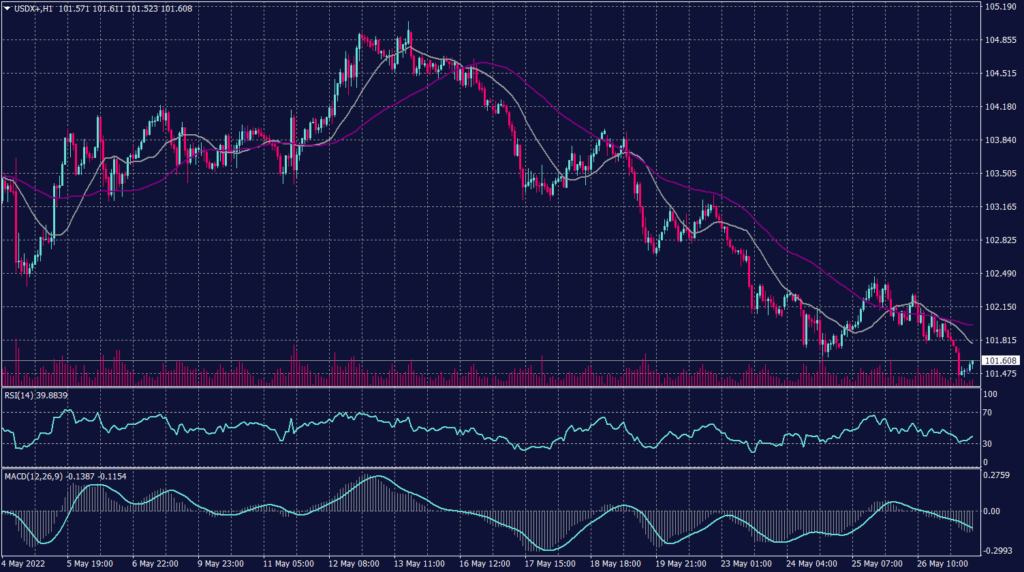
The dollar was set for its biggest weekly drop in nearly four months as traders lowered Federal Reserve rate hike expectations amid signs the U.S. central bank might slow or even pause its tightening cycle in the second half of the year.
The dollar index, which measures the greenback against a basket of six peers, fell as low as 101.43 for the first time since April 25. On a weekly basis, it was down 1.3%, its biggest weekly drop since the first week of February.
Technically:
The U.S. Dollar Index inched down 0.06% to 101.83 hovering near the lowest rate in a month. Additionally, the index still trading below the 20 day and 55 day moving average on the daily chart and hourly chart indicating a possibility for a further decline.
Likewise, the index is cementing its declining pattern on the hourly chart which targets 101.20 on the hourly chart. Technical indicators show a likelihood of further decline.
PIVOT POINT: 101.60
| SUPPORT | RESISTANCE |
| 101.40 | 102.60 |
| 101.20 | 103.10 |
| 101.00 | 103.35 |
Sterling Pounds (GBPUSD)
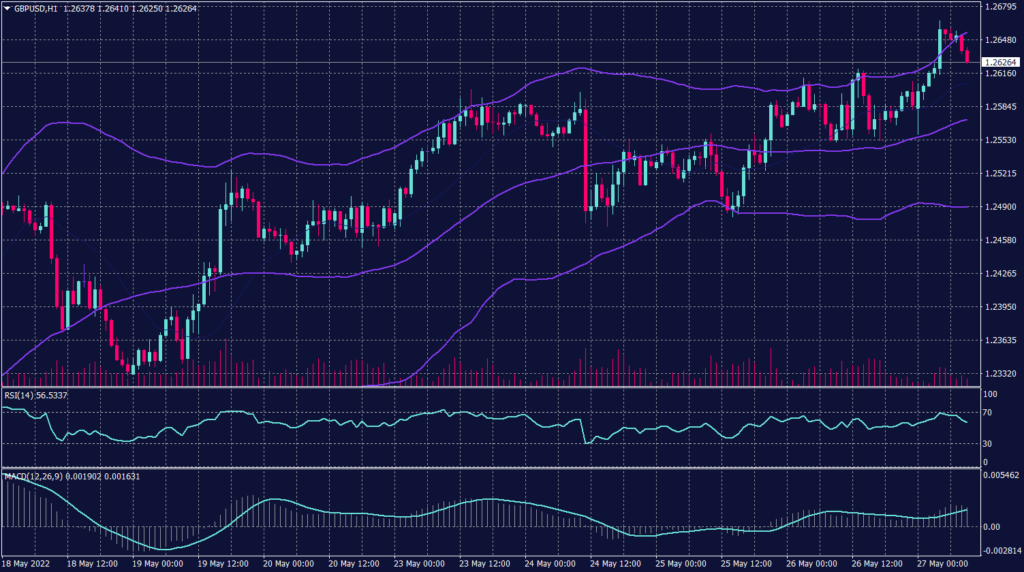
The Cable remains under pressure around the resistance level of 1.2550 on both the daily and hourly charts. However, the sterling pound remains inside the declining channel on the daily time frame.
The price chart is touching the upper band of Bollinger Bands indicators, which signals a higher possibility to retreat towards 1.2560 on the hourly chart and 1.2460 on the daily chart.
Meanwhile, the pair shows a possibility to move on the hourly time frame between 1.2440 and 1.2500. The RSI and MACD are showing signals for a further decline, while price action retains the reading of 1.2100 on the daily time frame.
PIVOT POINT: 1.2620
| SUPPORT | RESISTANCE |
| 1.2500 | 1.2695 |
| 1.2440 | 1.2750 |
| 1.2350 | 1.2790 |
Japanese Yen (USDJPY)
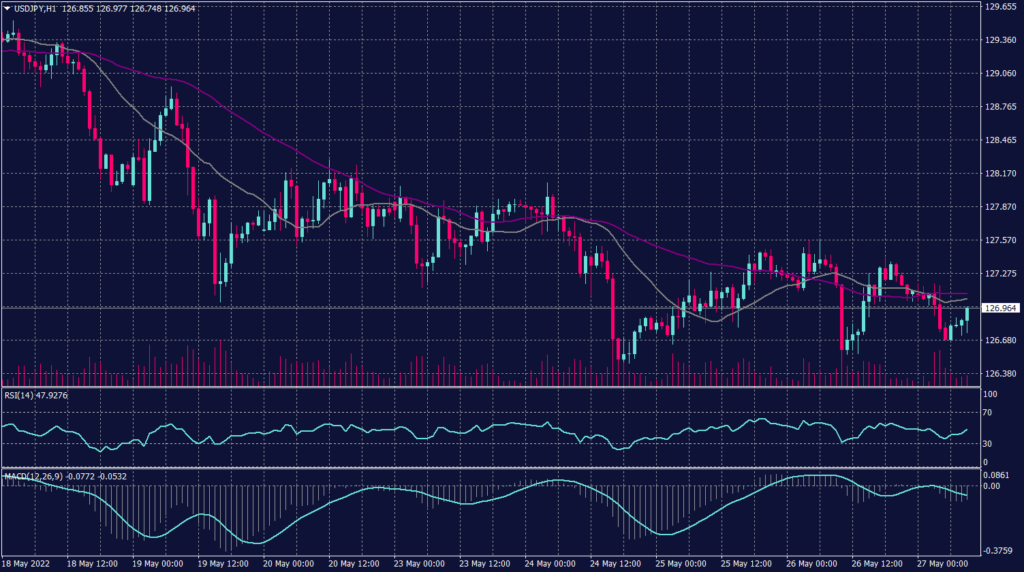
The Japanese Yen retains its momentum against the greenback and cements its trend after touching its best rate in a month below 127.00. The USDJPY pair has fallen in the early European session to 126.60.
Meanwhile, the pair is confirming the downtrend on the hourly chart and signalling a higher possibility of the continuation on the daily chart. While the moving average reading indicates that the current level is critical resistance, MACD and RSI readings remain neutral.
PIVOT POINT: 127.10
| SUPPORT | RESISTANCE |
| 126.30 | 127.40 |
| 125.90 | 128.00 |
| 125.60 | 128.40 |
Spot Gold (XAUUSD)
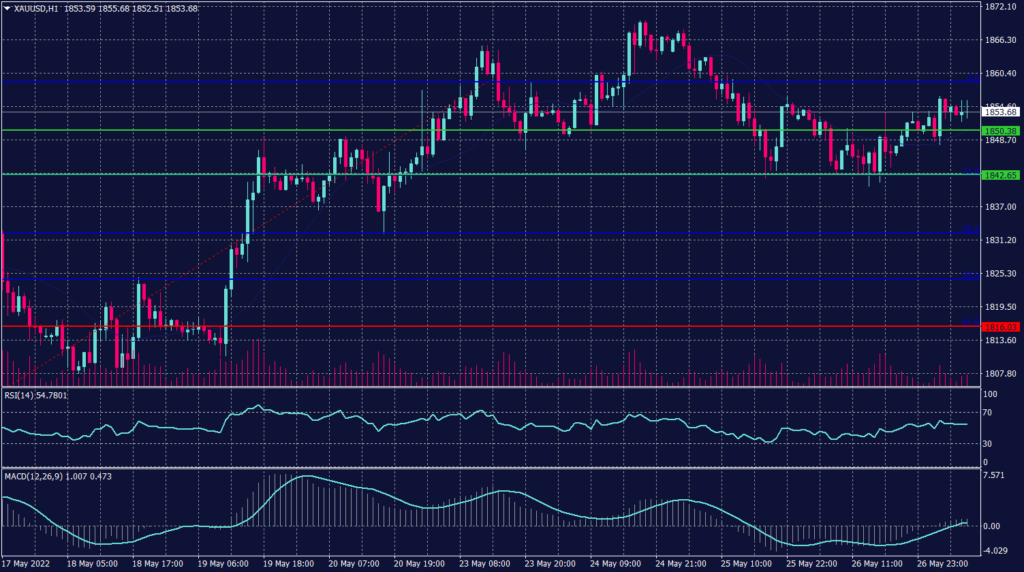
Gold was up this morning in Asia and was set for a second weekly gain after the dollar retreated from 20-year highs. Gold futures were up 0.28% to $1,852.70 and were up 0.2% in the week to date.
Technically:
Gold prices moved up during the early sessions after dipping yesterday. However, spot gold is hovering near the support at $1,850 per ounce and is expected to remain unless it broke below 1,842. Technical indicators show neutral patterns while volumes traded are getting lower.
PIVOT POINT: 1,850
| SUPPORT | RESISTANCE |
| 1,810 | 1,875 |
| 1,800 | 1,895 |
| 1,792 | 1,905 |
West Texas Crude (USOUSD)
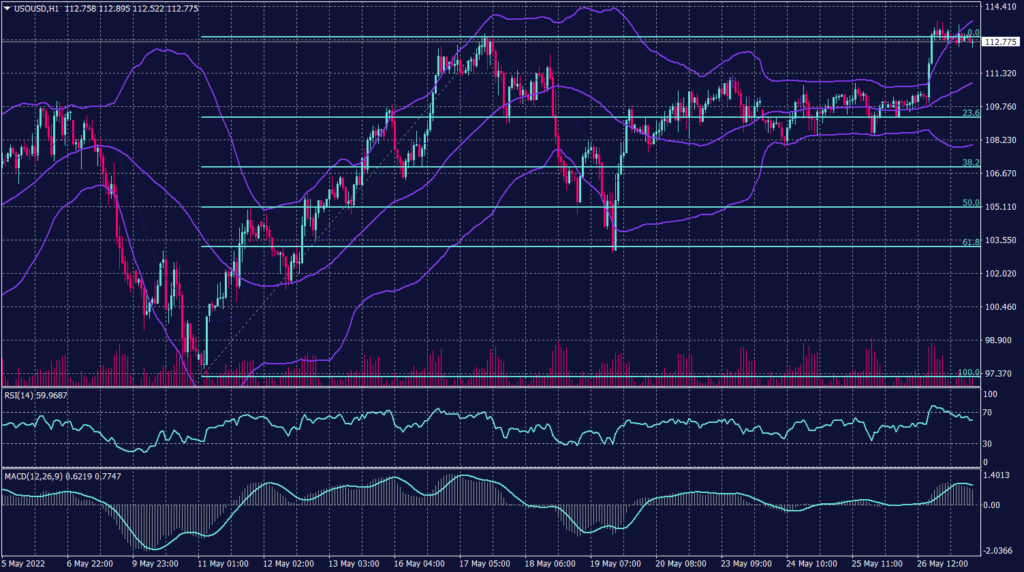
Oil prices dipped on Friday but stayed near a two-month high, with Brent crude on track for its biggest weekly jump in 6 weeks, supported by the prospect of an EU ban on Russian oil and the upcoming U.S. summer driving season.
Brent crude futures for July were down 0.2% at $117.19 a barrel after rising as high as $118.17 earlier in the session. The benchmark was still on track for a gain of about 4% this week. U.S. West Texas Intermediate (WTI) crude futures were down 0.2% at $113.85 a barrel.
Technically:
WTI remains to hover in a horizontal fashion above $110 in the short-term as worries about supply grow, but it remains in the uptrend channel on the daily chart. Meanwhile, on the hourly chart, WTI has formed support above $109 to weaken the resistance at $111.30 and reach $112.
Despite the heavy buying momentum, technical indicators show a possibility to see crude oil hovering around $109. However, Fibonacci retracement and 20 periods moving average show a higher probability of continuing climbing.
PIVOT POINT: 112.75
| SUPPORT | RESISTANCE |
| 107.10 | 115.00 |
| 105.75 | 115.60 |
| 104.30 | 117.00 |
S&P 500 (SPX500+)
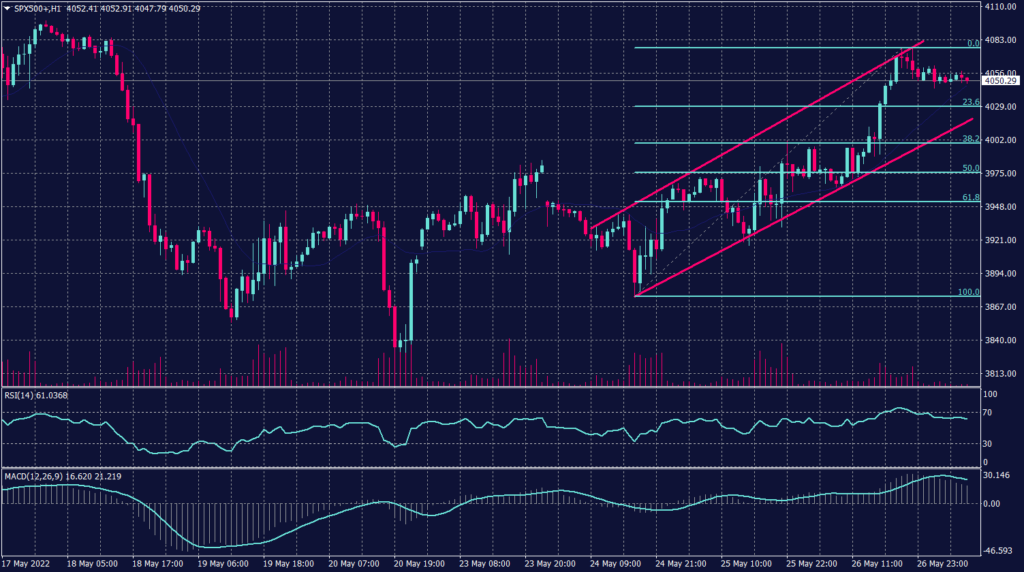
U.S. stock indices were lower during the early trading sessions. Futures on the Dow Jones Industrial Average shed 0.16%, S&P 500 futures slipped 0.18%, while Nasdaq 100 futures lost 0.22%. Additionally, the Dow rose for a fifth-straight trading day, added more than 500 points, the S&P 500 climbed about 2%, and the Nasdaq Composite rose nearly 2.7%.
The three indices are expected to close the week higher. The Dow is up 4.4%, the S&P 500 is 4% higher and the Nasdaq Composite is up 3.4% on the week.
Technically:
S&P 500 is trading between the support of 4,030 and the resistance of 4,100 heading toward recording its first green week after seven weekly losses. The index is moving above the 20 periods moving average and trying to snap up towards 4,100.
Technical indicators show a higher possibility to drop below 4,000 towards 3,970, while price action shows a likelihood to remain around the current levels.
PIVOT POINT: 4,000
| SUPPORT | RESISTANCE |
| 3,970 | 4,100 |
| 3,950 | 4,200 |
| 3,930 | 4,280 |
Bitcoin (BTCUSD)
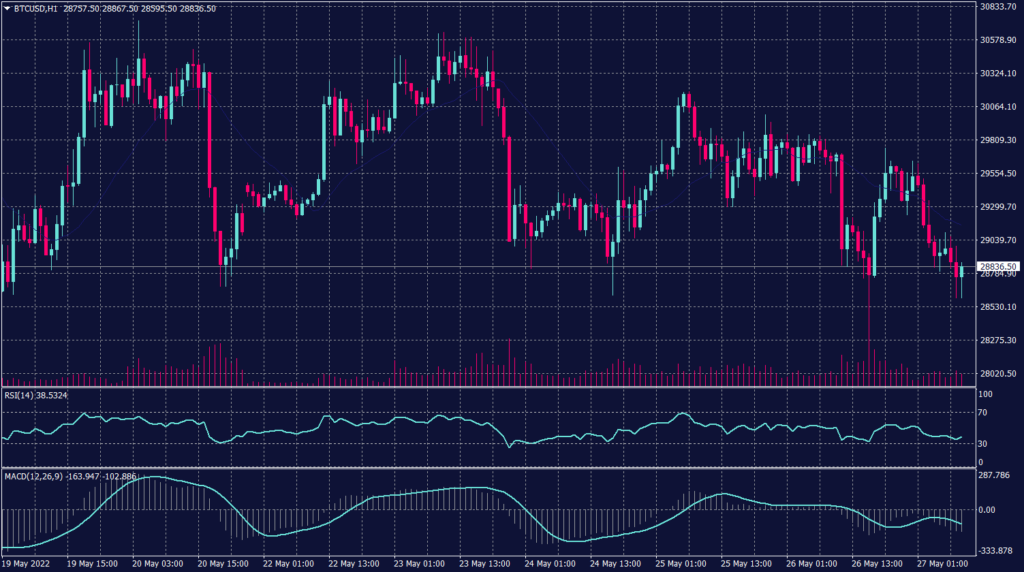
The cryptocurrency market settled into a holding pattern as traders decided to hold on after the Federal Open Market Committee (FOMC) meeting, where the Federal Reserve signaled that it intends to continue on its path of raising interest rates.
Technically:
The Bitcoin is trading at the support level of 28,800 and shows no sign of improvement on the hourly chart or on the daily.
Data shows that the price action for Bitcoin (BTCUSD) has continued to compress into an increasingly narrow trading range, but technical analysis indicators are not providing much insight on what direction a possible breakout could take.
PIVOT POINT: 28,800
| SUPPORT | RESISTANCE |
| 28,700 | 29,000 |
| 28,500 | 29,270 |
| 27,700 | 29,550 |
Tags
Open Live Account
Please enter a valid country
No results found
No results found
Please enter a valid email
Please enter a valid verification code
1. 8-16 characters + numbers (0-9) 2. blend of letters (A-Z, a-z) 3. special characters (e.g, !a#S%^&)
Please enter the correct format
Please tick the checkbox to proceed
Please tick the checkbox to proceed
Important Notice
STARTRADER does not accept any applications from Australian residents.
To comply with regulatory requirements, clicking the button will redirect you to the STARTRADER website operated by STARTRADER PRIME GLOBAL PTY LTD (ABN 65 156 005 668), an authorized Australian Financial Services Licence holder (AFSL no. 421210) regulated by the Australian Securities and Investments Commission.
CONTINUEImportant Notice for Residents of the United Arab Emirates
In alignment with local regulatory requirements, individuals residing in the United Arab Emirates are requested to proceed via our dedicated regional platform at startrader.ae, which is operated by STARTRADER Global Financial Consultation & Financial Analysis L.L.C.. This entity is licensed by the UAE Capital Market Authority (CMA) under License No. 20200000241, and is authorised to introduce financial services and promote financial products in the UAE.
Please click the "Continue" button below to be redirected.
CONTINUEError! Please try again.

