


market news summary
USDX rising high;
Yen trades solo;
Crude oil might not hold;
Gold finds refuge.
U.S. Dollar Index (USDX)
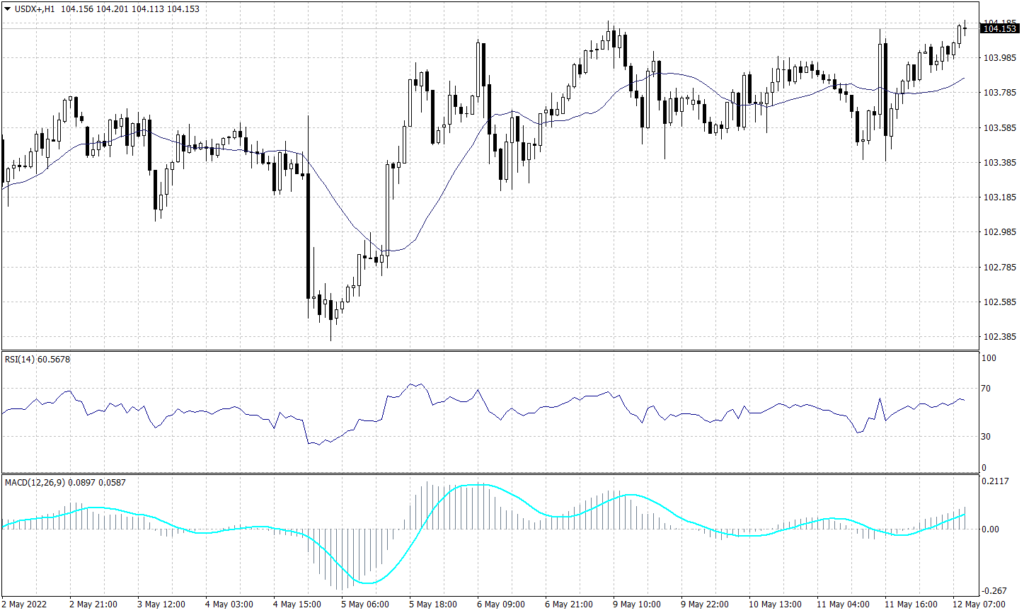
The U.S. Dollar index traded around its highest level in two decades at 104.23 amid the inflation data yesterday. The Greenback cemented its long-term upward trend closing above the support of 103.60 and forming a rising pattern.
Technically, the index cemented the strong support above 103.60 on the daily chart. However, on the hourly chart, technical indicators and trend lines expect the index to trade lower.
PIVOT POINT: 104.10
| R1 | R2 | R3 | |
| RESISTANCE | 104.30 | 104.60 | 104.80 |
| S1 | S2 | S3 | |
| SUPPORT | 103.60 | 103.20 | 102.70 |
Euro (EURUSD)
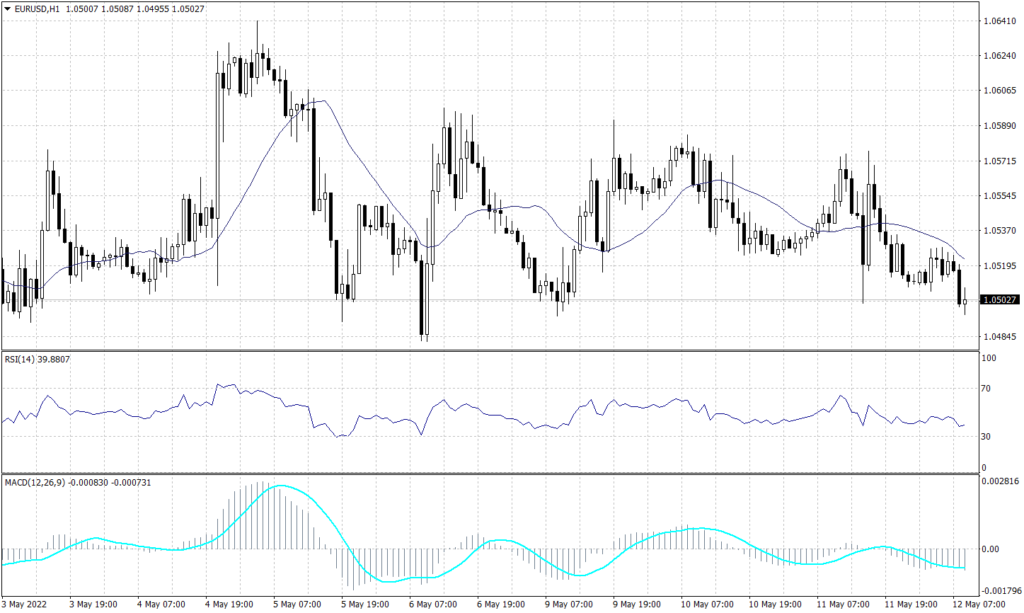
The common currency remains on the primary downtrend, in both long-term and short-term time frames. The EURUSD found slight support near the lowest level since 2017 at 1.0510, the pair is not showing signs of recovery after the U.S. inflation data.
Technical indicators signal a continuation towards 1.04925. Meanwhile, in the longer term, the pair is set to continue its primary downtrend.
PIVOT POINT: 1.0510
| R1 | R2 | R3 | |
| RESISTANCE | 1.0650 | 1.0675 | 1.0730 |
| S1 | S2 | S3 | |
| SUPPORT | 1.0490 | 1.0410 | 1.0350 |
Sterling Pounds (GBPUSD)
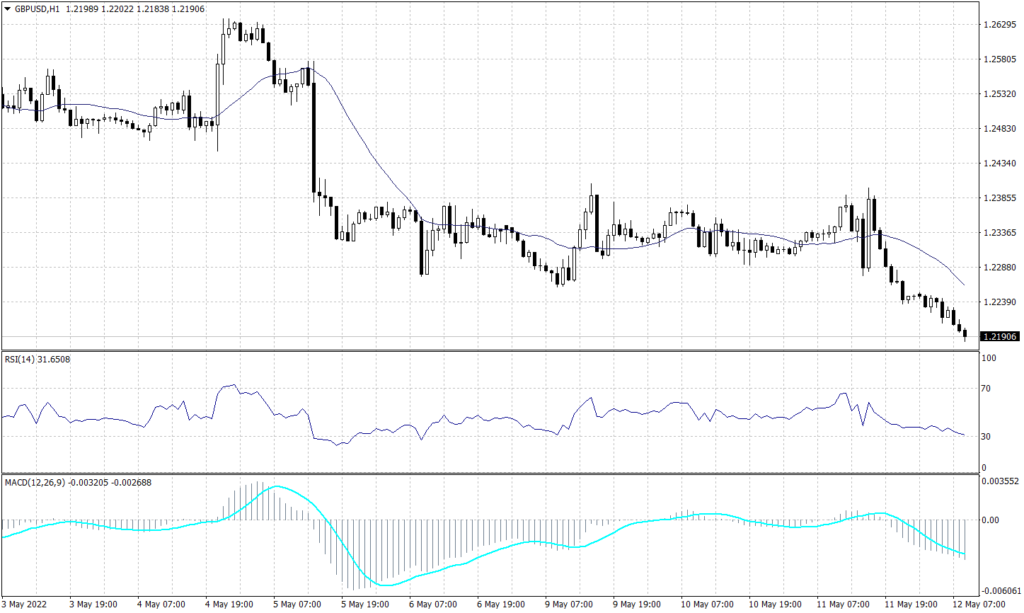
The Cable traded lower today as the U.S. dollar is gaining massive momentum after the U.S. CPI figures, which pushed the pound to its lowest rate in 11 months. The Cable is set to continue the primary decline to touch its lowest rate in a year below 1.2100.
On the daily chart, the pair is expected to fall to 1.2070, while the hourly chart shows a likelihood to trade around 1.2000 during the day. The RSI and MACD are showing signals for a further decline in a slow fashion, while price action retains the reading of 1.2100 during the day.
PIVOT POINT: 1.2200
| R1 | R2 | R3 | |
| RESISTANCE | 1.2400 | 1.2565 | 1.2690 |
| S1 | S2 | S3 | |
| SUPPORT | 1.2070 | 1.1980 | 1.1900 |
Japanese Yen (USDJPY)
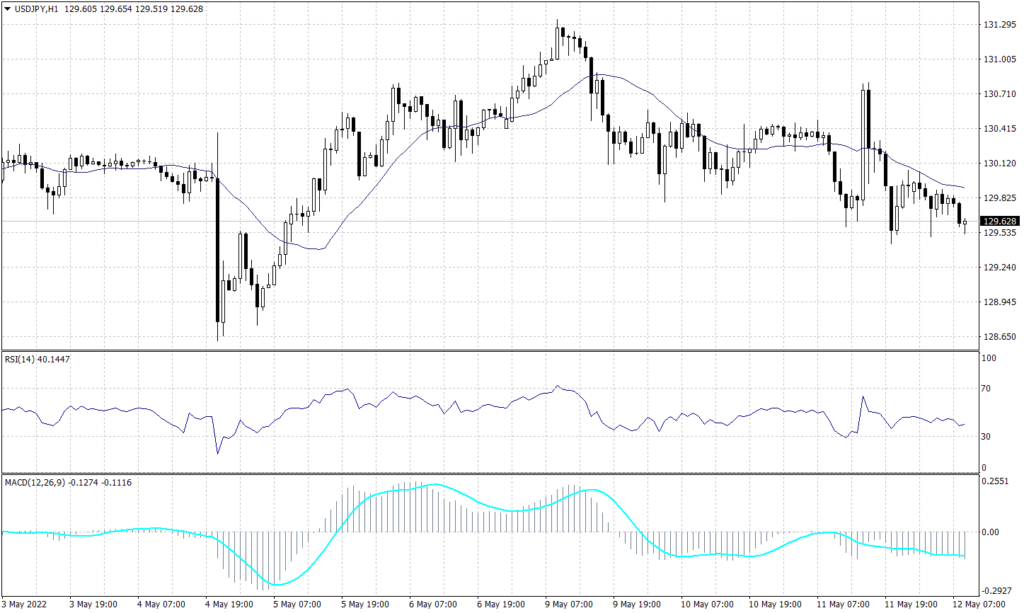
Unlike other majors, the samurai currency gained ground against the greenback this morning as high inflation might help the Japanese economy to recover.
The USDJPY pair broke below the support of 130.30 and formed a declining pattern on the hourly chart. Meanwhile, on the daily chart, the pair remains in the uptrend unless it broke below the support of 128.70. While the moving average reading indicates that the current level is critical resistance, MACD and RSI readings are neutral.
PIVOT POINT: 129.60
| R1 | R2 | R3 | |
| RESISTANCE | 130.60 | 131.30 | 132.00 |
| S1 | S2 | S3 | |
| SUPPORT | 128.70 | 128.35 | 128.00 |
Spot Gold (XAUUSD)
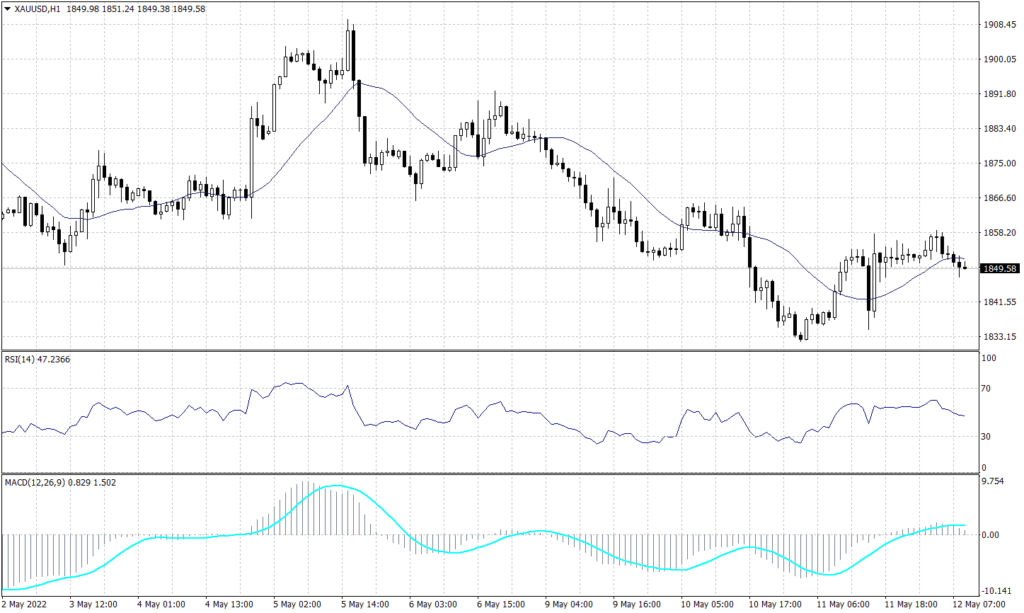
The yellow metal found a refuge above around $1,850 during the Asian session, which slowed down the effect of the U.S. CPI data on the safe haven. Gold prices retain their negative trend on the daily chart, and it is likely to continue the downward trend targeting 1,825.
The daily chart shows a continuation of the bearish trend line targeting the range between 1,825 to 1,800. Meanwhile, the hourly chart shows support at the current levels that might slow down the decline. Furthermore, both the RSI and the MACD imply that the bearish trend will continue.
PIVOT POINT: 1,840
| R1 | R2 | R3 | |
| RESISTANCE | 1,890 | 1,895 | 1,905 |
| S1 | S2 | S3 | |
| SUPPORT | 1,825 | 1,800 | 1,792 |
WTI (USOUSD)
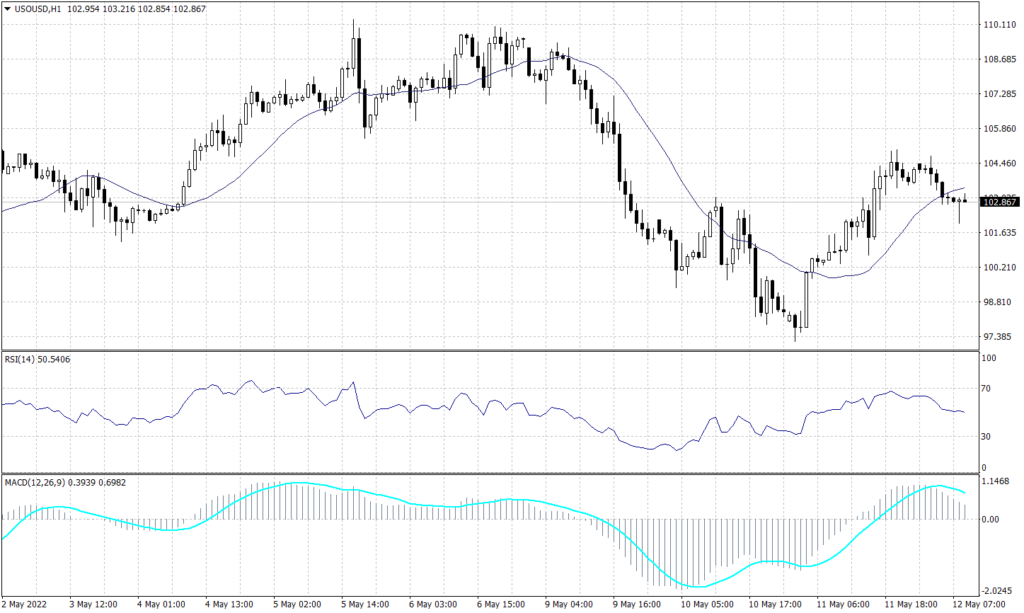
West Texas Intermediate lost another nearly 2% during the Asian sessions as the inflation raises concerns regarding the demand.
Technical indicators signal a further decline if prices broke below the $100 level. Otherwise, the prices will be unlikely to rebound further than 103.50 under the current market conditions.
PIVOT POINT: 101.50
| R1 | R2 | R3 | |
| RESISTANCE | 103.40 | 105.10 | 108.40 |
| S1 | S2 | S3 | |
| SUPPORT | 97.25 | 95.20 | 90.00 |
Tags
Open Live Account
Please enter a valid country
No results found
No results found
Please enter a valid email
Please enter a valid verification code
1. 8-16 characters + numbers (0-9) 2. blend of letters (A-Z, a-z) 3. special characters (e.g, !a#S%^&)
Please enter the correct format
Please tick the checkbox to proceed
Please tick the checkbox to proceed
Important Notice
STARTRADER does not accept any applications from Australian residents.
To comply with regulatory requirements, clicking the button will redirect you to the STARTRADER website operated by STARTRADER PRIME GLOBAL PTY LTD (ABN 65 156 005 668), an authorized Australian Financial Services Licence holder (AFSL no. 421210) regulated by the Australian Securities and Investments Commission.
CONTINUEImportant Notice for Residents of the United Arab Emirates
In alignment with local regulatory requirements, individuals residing in the United Arab Emirates are requested to proceed via our dedicated regional platform at startrader.ae, which is operated by STARTRADER Global Financial Consultation & Financial Analysis L.L.C.. This entity is licensed by the UAE Capital Market Authority (CMA) under License No. 20200000241, and is authorised to introduce financial services and promote financial products in the UAE.
Please click the "Continue" button below to be redirected.
CONTINUEError! Please try again.

