


Bitcoin Technical Analysis
Bitcoin reached a new all-time high today at $124,492 before pulling back sharply. The price had been trading above the 5-period and 10-period moving averages, indicating strong bullish momentum, but the latest decline has brought it close to testing the 30-period moving average as potential short-term support.
MACD has just flipped to red falling below the zero line, and the MACD line has crossed below the signal line, indicating a shift in momentum from bullish to bearish, at least for the short term.
If the price closes below the 30-period MA, we could see a further downside toward the $121,000–$120,500 area. However, if support holds, the recent pullback could turn into a consolidation phase before another push to the upside.
Bitcoin (BTCUSD) 1H Chart
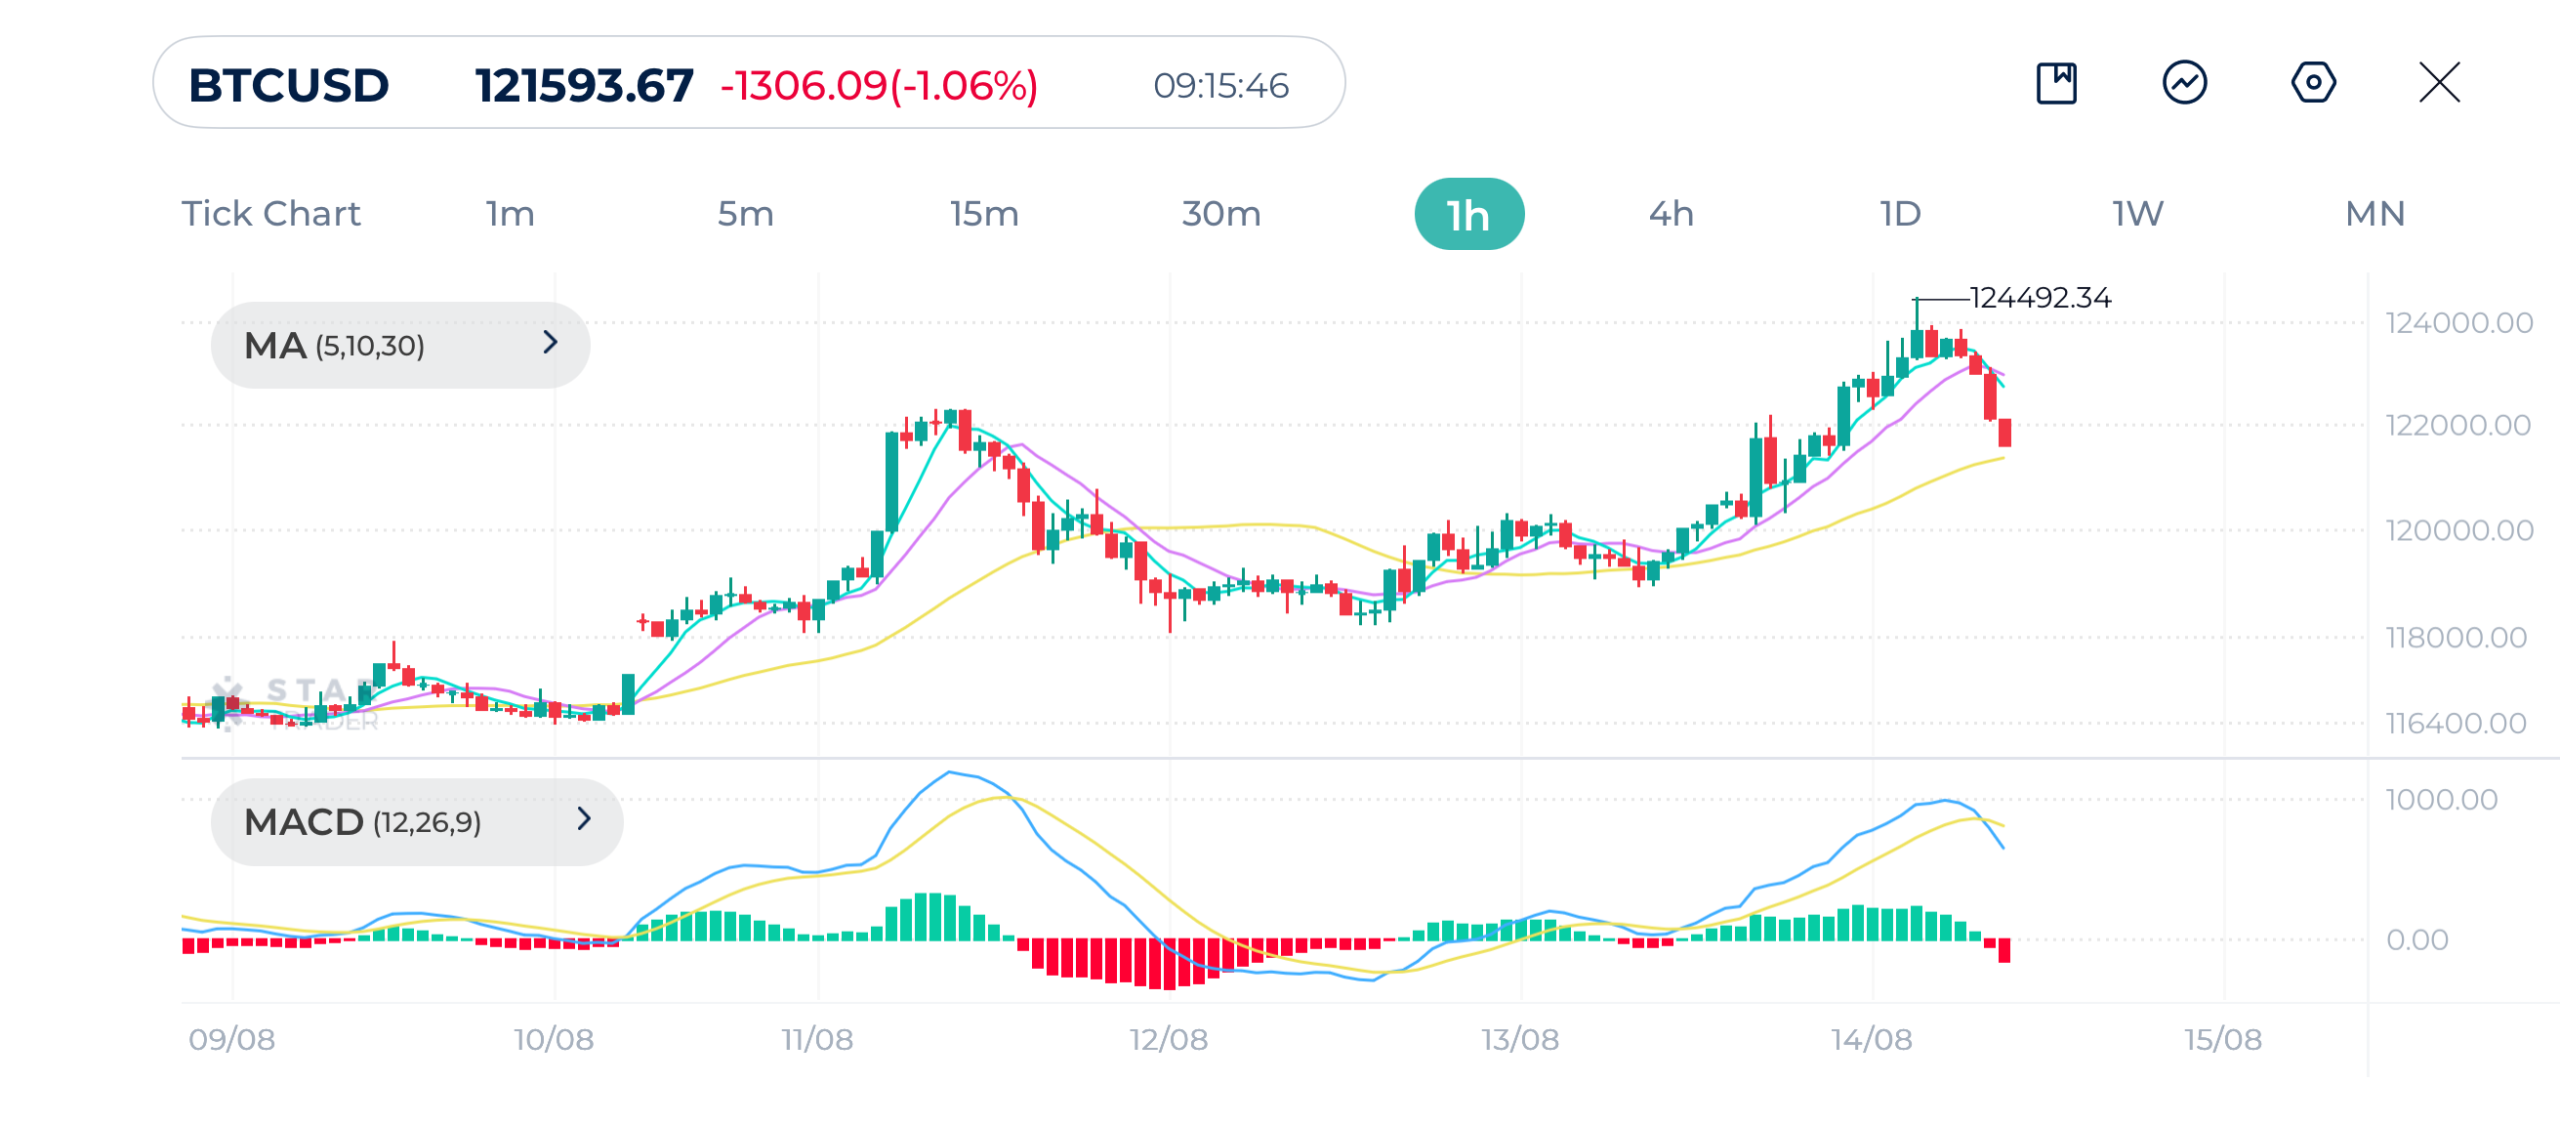
| Resistance | $122,536 | $123,886 | $124,501 |
| Support | $120,903 | $120,087 | $118,955 |
USDJPY Technical Analysis
USDJPY has been in a steady downtrend due to the weakness of the US dollar, with the pair now touching a low of 146.22. The price is trading well below all three moving averages, which indicates persistent selling pressure.
Both the MACD lines are in negative territory with a widening gap, and the histogram shows strong red bars, showing bearish momentum. Unless the pair reverses with a strong rebound, the next potential support lies in the 145.80–145.50 range.
Any recovery attempt requires a breakout above the 146.80–147.00 resistance zone to suggest a trend reversal.
USDJPY 1H Chart
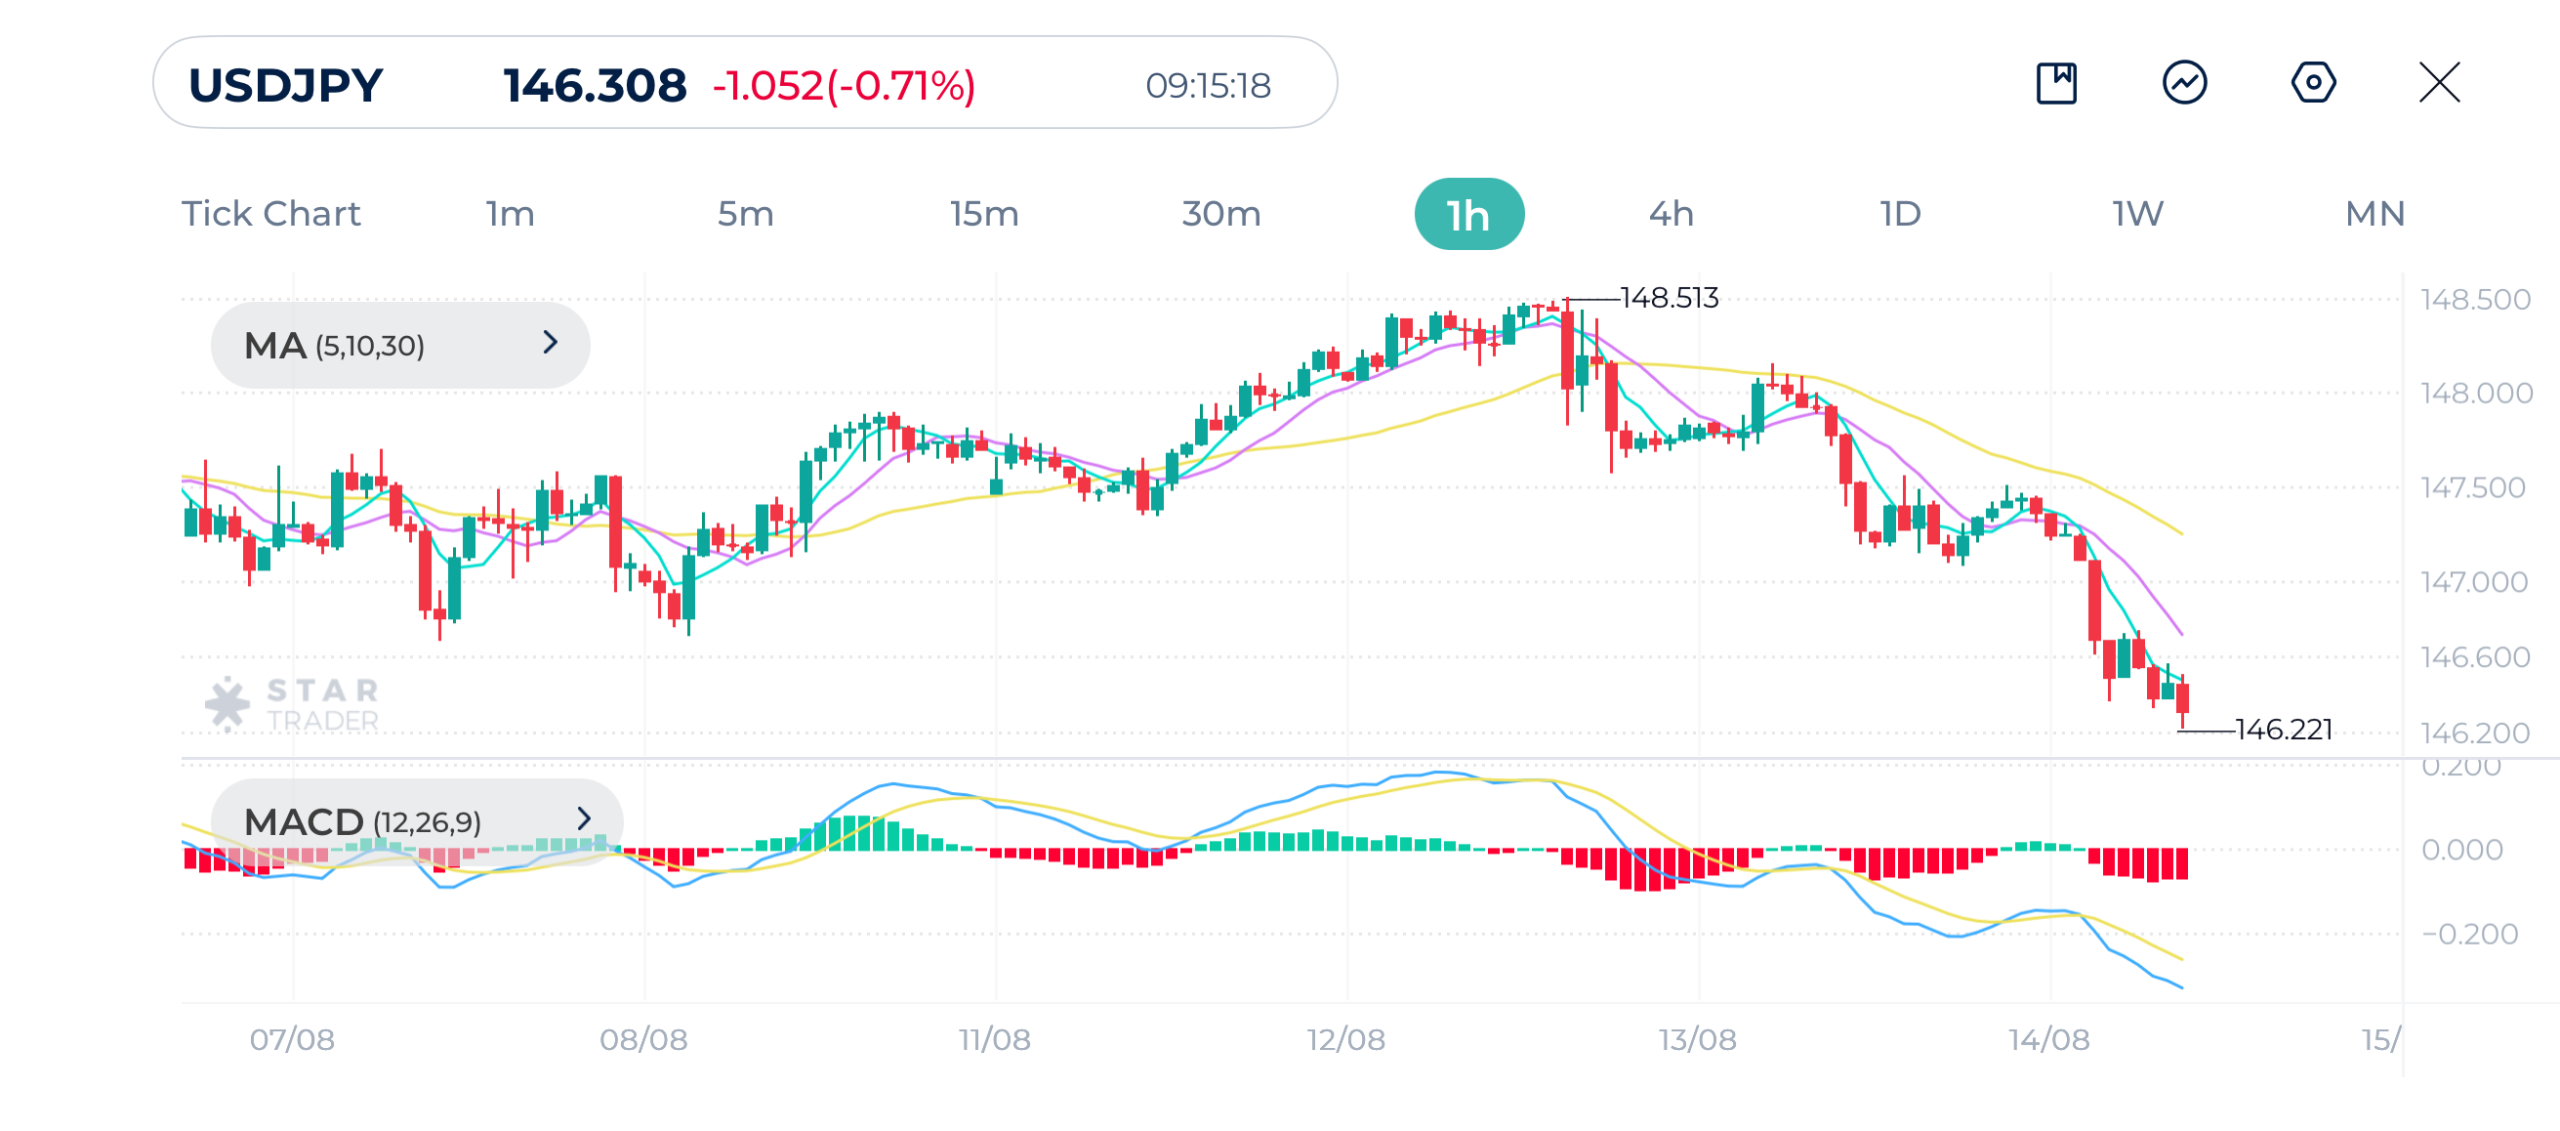
| Resistance | 146.76 | 147.14 | 147.56 |
| Support | 145.84 | 145.87 | 145.17 |
Silver Technical Analysis
Silver prices show strong momentum upward, reaching a weekly high at $38.72 before facing selling pressure, possibly from profit taking. The price action had maintained a steady uptrend above the moving averages, but the recent drop has brought it back toward the 30-period moving average, which now acts as a crucial support zone.
MACD also made a bearish crossover, and the histogram is turning negative, reflecting weakening upward momentum. If selling pressure continues, a deeper retracement toward the $38.10–$37.90 area is possible. On the other hand, a rebound from current levels could retest $38.70, but it would require renewed buying volume to sustain the move.
Silver (XAGUSD) 1H Chart
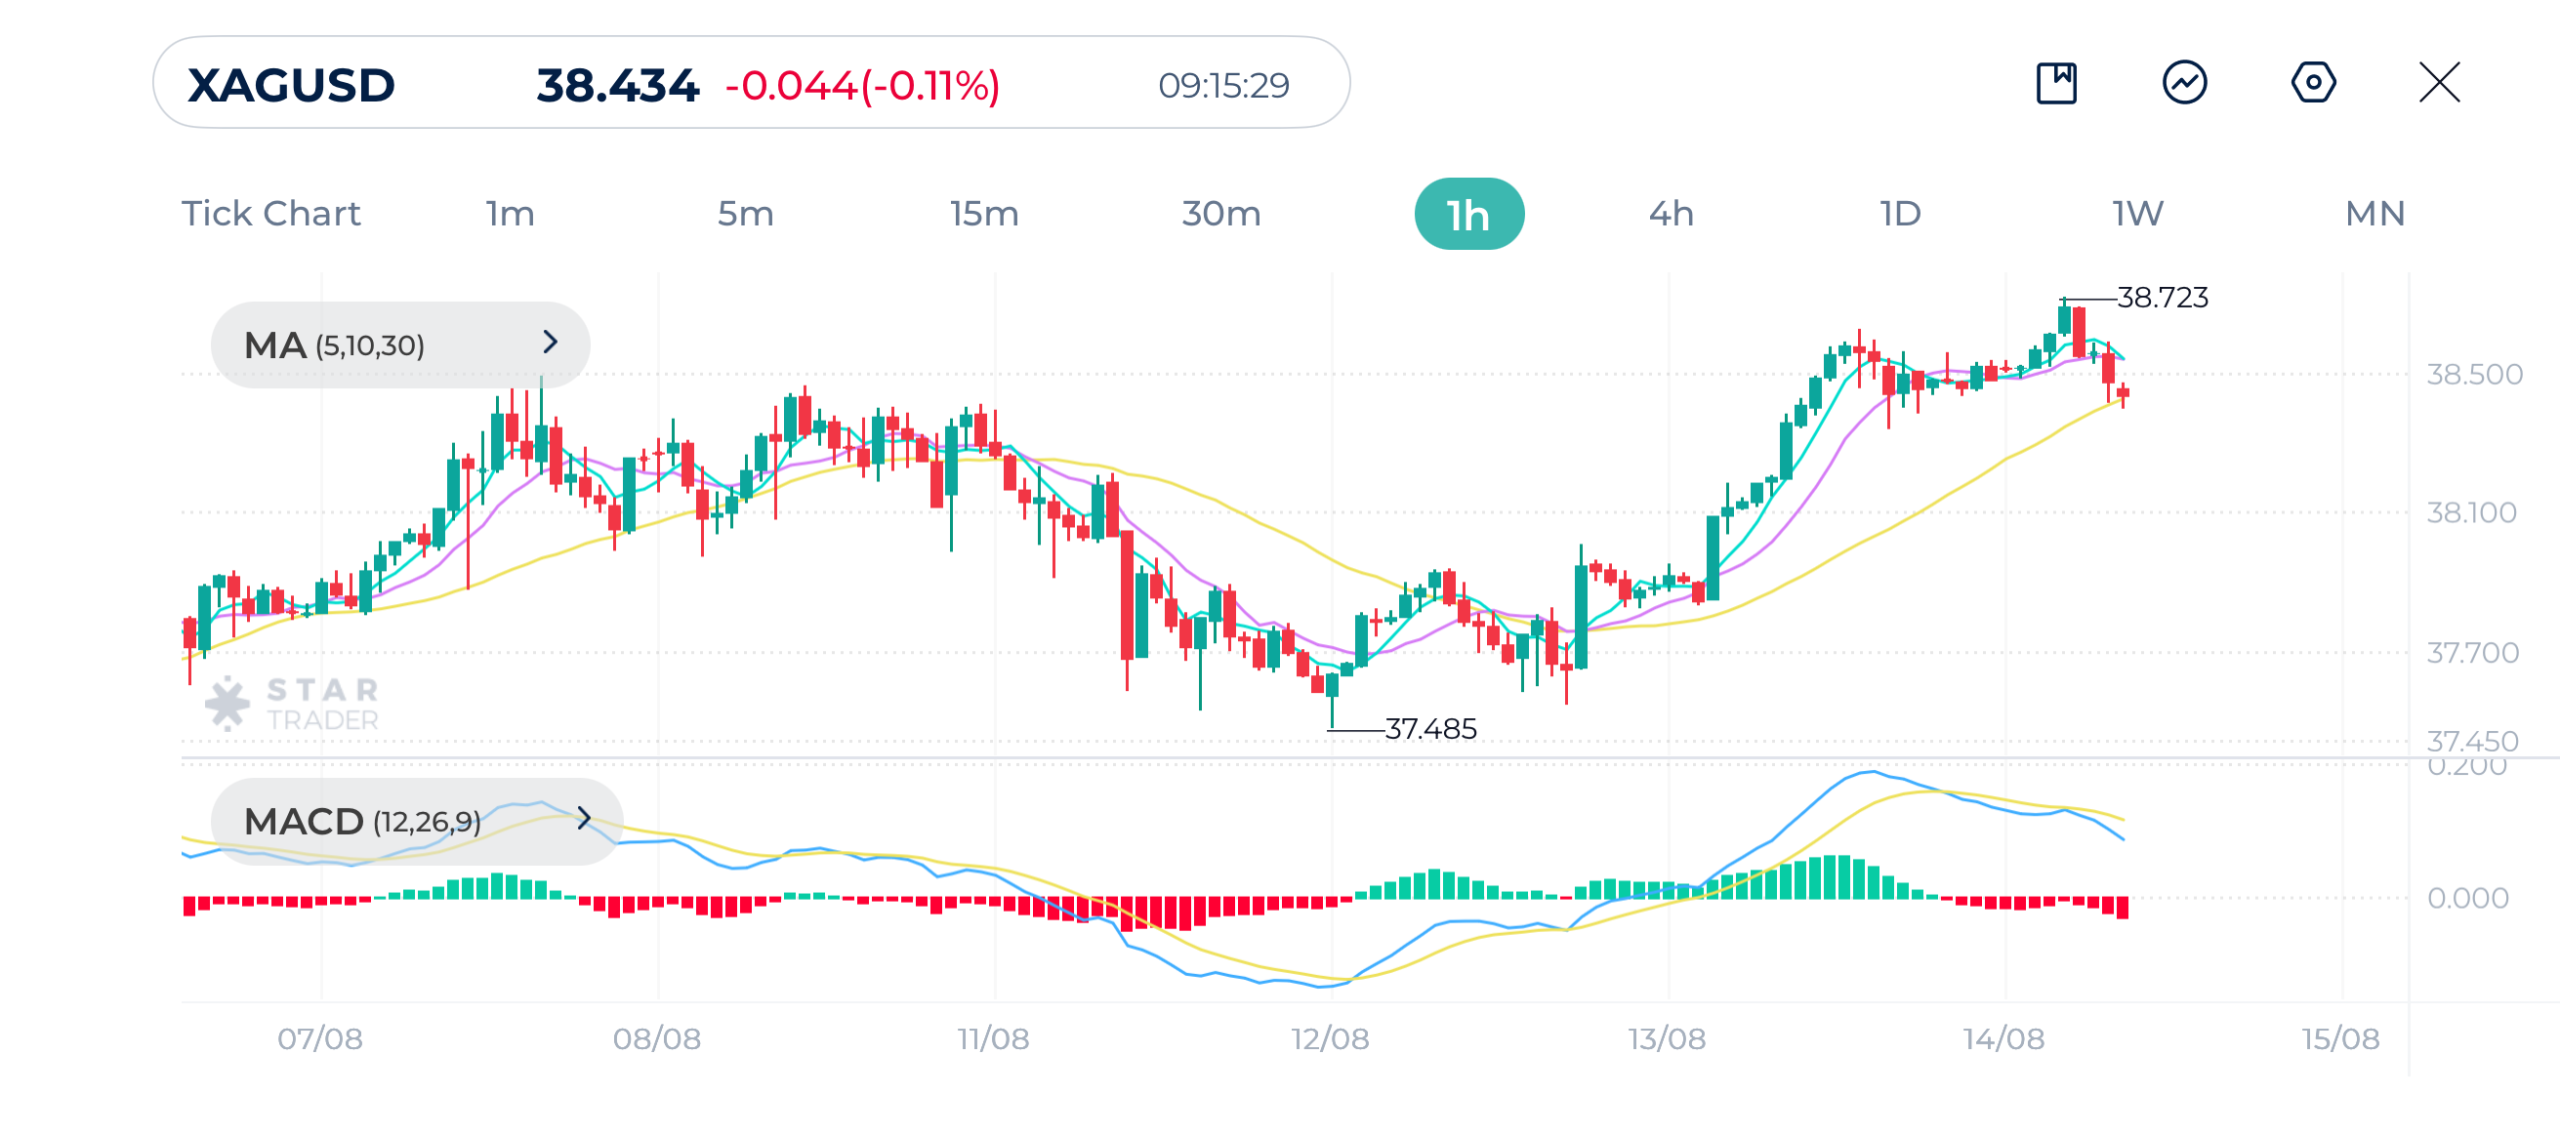
| Resistance | $38.73 | $38.93 | $39.20 |
| Support | $38.33 | $38.16 | $37.85 |
Tags
Open Live Account
Please enter a valid country
No results found
No results found
Please enter a valid email
Please enter a valid verification code
1. 8-16 characters + numbers (0-9) 2. blend of letters (A-Z, a-z) 3. special characters (e.g, !a#S%^&)
Please enter the correct format
Please tick the checkbox to proceed
Please tick the checkbox to proceed
Important Notice
STARTRADER does not accept any applications from Australian residents.
To comply with regulatory requirements, clicking the button will redirect you to the STARTRADER website operated by STARTRADER PRIME GLOBAL PTY LTD (ABN 65 156 005 668), an authorized Australian Financial Services Licence holder (AFSL no. 421210) regulated by the Australian Securities and Investments Commission.
CONTINUEImportant Notice for Residents of the United Arab Emirates
In alignment with local regulatory requirements, individuals residing in the United Arab Emirates are requested to proceed via our dedicated regional platform at startrader.ae, which is operated by STARTRADER Global Financial Consultation & Financial Analysis L.L.C.. This entity is licensed by the UAE Capital Market Authority (CMA) under License No. 20200000241, and is authorised to introduce financial services and promote financial products in the UAE.
Please click the "Continue" button below to be redirected.
CONTINUEError! Please try again.

