








 Web Trader MT5









Bitcoin Technical Analysis
Bitcoin is clearly in a strong downtrend. After facing a strong resistance near $69,000, Bitcoin rolled over and printed a sequence of lower highs and lower lows. The breakdown accelerated with a sharp impulsive selloff that pushed price into the $62,600–$63,000 region.
The moving averages (5, 10, 30) are fully bearishly aligned. Price remains well below all three averages, confirming strong downside momentum and sustained selling pressure rather than a simple pullback.
The MACD line is still beneath the signal line, suggesting that the trend remains bearish. From a structure perspective, $64,000–$65,000 now acts as immediate resistance. As long as prices remain below this zone, rallies are likely to be limited. A break below $62,600 would expose further downside toward $61,800 and potentially the psychological $60,000 region. A meaningful reversal would require a reclaim of $66,000 with strong momentum and moving average rotation.
Bitcoin 1H Chart
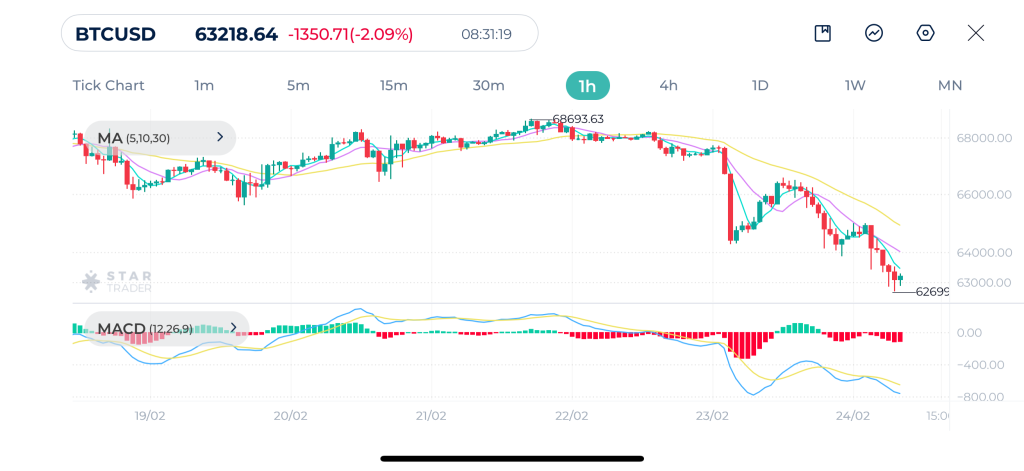
| Resistance | $63,716 | $63,837 | $65,000 |
| Support | $62,700 | $61,200 | $60,000 |
Gold Technical Analysis
Gold remains in a broader long term uptrend despite the current pullback. The recent decline appears corrective within that bullish structure. Importantly, price is still trading above the rising 30-period moving average, which continues to slope upward, signaling that the medium term bullish bias remains intact.
The shorter moving averages (5 and 10) have crossed slightly downward, reflecting near-term weakness. However, this crossover has not yet produced a structural breakdown. The MACD shows declining bullish momentum, with the MACD line crossing below the signal line, indicating a cooling phase
Key support lies in the $5,080–$5,100 zone, followed by stronger support around $5,000 where the 30-period moving average and prior consolidation sit. If buyers defend these areas, the uptrend could resume toward $5,250 and potentially higher. A decisive break below $5,000 would weaken the bullish structure and shift bias toward deeper retracement.
Gold 1H Chart
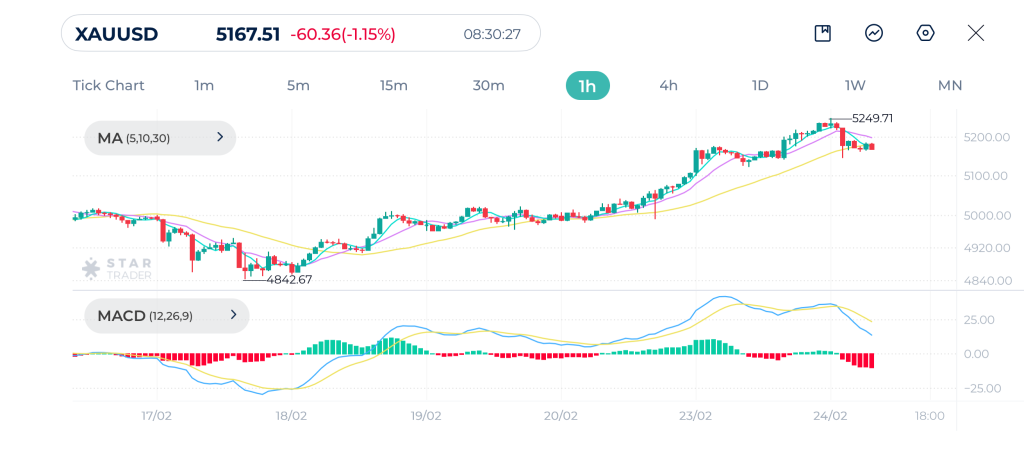
| Resistance | $5,191 | $5,216 | $5,236 |
| Support | $5,144 | $51,109 | $5,074 |
Dow Jones Technical Analysis
Dow Jones has shifted from range bound consolidation into short term bearish momentum. After peaking near 49,924, price formed lower highs and then broke down sharply toward 48,761. The 5 and 10 moving averages have crossed below MA(30), signaling a transition from neutral to bearish bias.
The MACD confirms the shift. The indicator dropped sharply below the zero line with strong negative histogram expansion, reflecting momentum acceleration to the downside. A break below 48,750 would likely trigger continuation toward 48,500 and possibly 48,200. For buyers to regain control, the index would need to reclaim 49,400 with improving momentum and bullish moving averages realignment.
Dow Jones 1H Chart
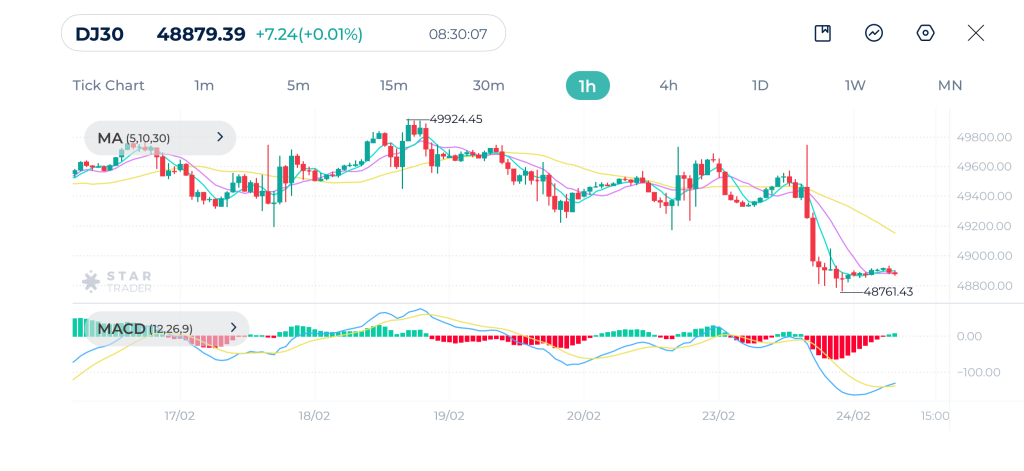
| Resistance | 48,957 | 49,000 | 49,083 |
| Support | 48,726 | 48,617 | 48,451 |
Tags


Open Live Account
 Email Address
 Phone Number
Important Notice
STARTRADER does not accept any applications from Australian residents.
To comply with regulatory requirements, clicking the button will redirect you to the STARTRADER website operated by STARTRADER PRIME GLOBAL PTY LTD (ABN 65 156 005 668), an authorized Australian Financial Services Licence holder (AFSL no. 421210) regulated by the Australian Securities and Investments Commission.
Important Notice for Residents of the United Arab Emirates
In alignment with local regulatory requirements, individuals residing in the United Arab Emirates are requested to proceed via our dedicated regional platform at startrader.ae, which is operated by STARTRADER Global Financial Consultation & Financial Analysis L.L.C.. This entity is licensed by the UAE Capital Market Authority (CMA) under License No. 20200000241, and is authorised to introduce financial services and promote financial products in the UAE.
Please click the "Continue" button below to be redirected.


